
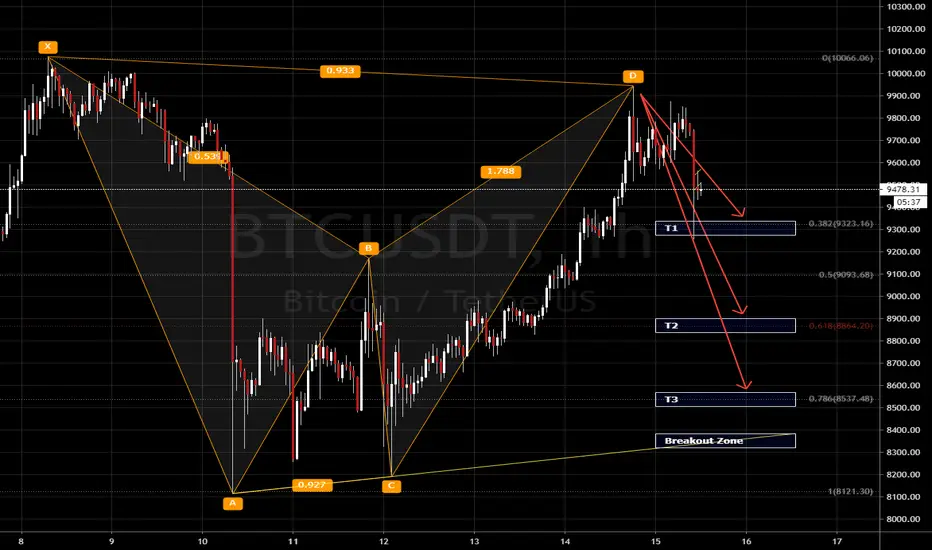
Posting this XABCD pattern late although I had this drawn up on my chart since the last day now.
T1 has already been hit and potential for T2 to hit. The indicators on 4H still show further potential downside. Also, the measured moved of this potential bear flag will nearly reach T2.
If the PA reaches the breakout zone, then we can expect a temporary reversal for further downside.
But take this with a grain of salt as it is post-halving and the bulls have been very strong.
Thanks for taking the time to read this idea.
If you found it interesting, please support my efforts by leaving your feedback or questions below and upvote this chart.
Cheers!
These ideas are not financial advice.
T1 has already been hit and potential for T2 to hit. The indicators on 4H still show further potential downside. Also, the measured moved of this potential bear flag will nearly reach T2.
If the PA reaches the breakout zone, then we can expect a temporary reversal for further downside.
But take this with a grain of salt as it is post-halving and the bulls have been very strong.
Thanks for taking the time to read this idea.
If you found it interesting, please support my efforts by leaving your feedback or questions below and upvote this chart.
Cheers!
These ideas are not financial advice.
ノート
A quick update with what I am seeing now. MACD, Godmode and free Cipher all showing similar structure as the previous dump. Also it is logical that if it dumps like last weekend, it starts soon as there will be a lack of institutional money that has been flowing in. ノート
Another XABCD formed. Sideways and downwards movement which is very different than we have seen in weeks. I am not sure if we will see a huge dump, but I do believe we continue downwards.

免責事項
これらの情報および投稿は、TradingViewが提供または承認する金融、投資、取引、またはその他の種類の助言もしくは推奨であることを意図したものではなく、またこれらに該当するものでもありません。詳細は利用規約をご覧ください。
免責事項
これらの情報および投稿は、TradingViewが提供または承認する金融、投資、取引、またはその他の種類の助言もしくは推奨であることを意図したものではなく、またこれらに該当するものでもありません。詳細は利用規約をご覧ください。