
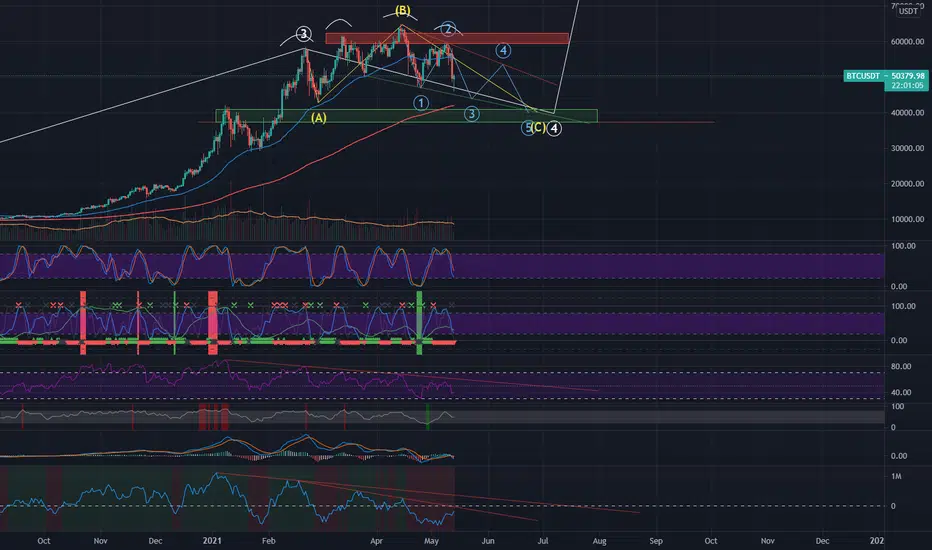
there is a possibility that BTC is currently in a flat expanded ABC correction of the fourth wave. we seem to be currently in wave C of that correction that can have 5 subwaves... Until that Bearish divergence trendline on the RSI gets broken. this theory still stands...
the bottom indicator is an experimental indicator relying on the net Volume 21-day average. it is also diverging bearishly and accelerating, meaning the sell offs are becoming more agressive...
the bottom indicator is an experimental indicator relying on the net Volume 21-day average. it is also diverging bearishly and accelerating, meaning the sell offs are becoming more agressive...

For More TA join our Discord group:
discord.gg/ATBB8wnXTd
and follow me on twitter:
twitter.com/cryptoheat
and check out my videos on youtube:
youtube.com/channel/UCiiOggxpyJGL3AIRnlMeWNQ
discord.gg/ATBB8wnXTd
and follow me on twitter:
twitter.com/cryptoheat
and check out my videos on youtube:
youtube.com/channel/UCiiOggxpyJGL3AIRnlMeWNQ
免責事項
これらの情報および投稿は、TradingViewが提供または承認する金融、投資、取引、またはその他の種類の助言もしくは推奨であることを意図したものではなく、またこれらに該当するものでもありません。詳細は利用規約をご覧ください。
For More TA join our Discord group:
discord.gg/ATBB8wnXTd
and follow me on twitter:
twitter.com/cryptoheat
and check out my videos on youtube:
youtube.com/channel/UCiiOggxpyJGL3AIRnlMeWNQ
discord.gg/ATBB8wnXTd
and follow me on twitter:
twitter.com/cryptoheat
and check out my videos on youtube:
youtube.com/channel/UCiiOggxpyJGL3AIRnlMeWNQ
免責事項
これらの情報および投稿は、TradingViewが提供または承認する金融、投資、取引、またはその他の種類の助言もしくは推奨であることを意図したものではなく、またこれらに該当するものでもありません。詳細は利用規約をご覧ください。