
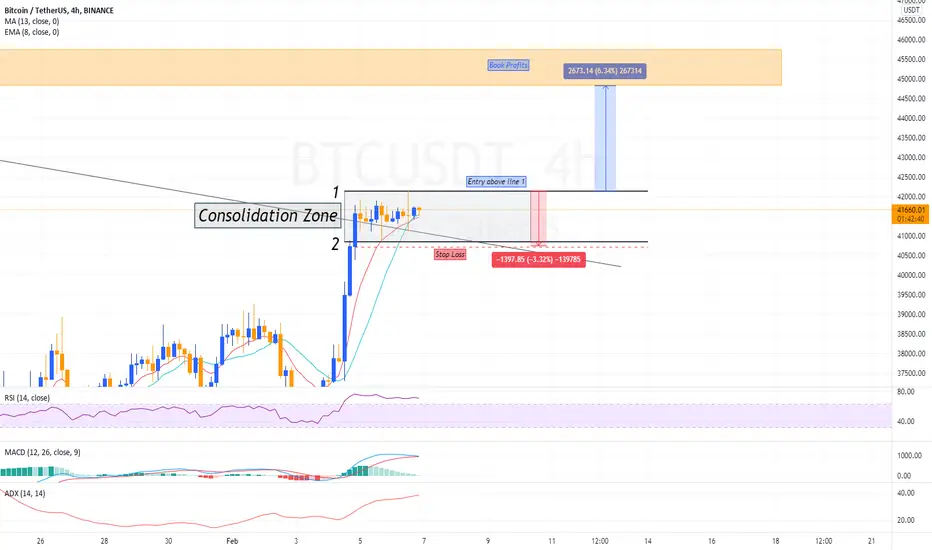
BTC seems to be forming a bullish rectangle on the H4 chart, I will attach a photo in a comment below for reference. I have drawn out a couple lines for entries, sl and tp if this bullish flag plays out.
Bullish flag breakout generally moves the same ammount as the move before, in this case BTC jumped about 8%, so therefore we can expect another 8% jump if the H4 candle closes above the resistance line (Line 1).
I hope this helps, even if it doesn't play out.
Please leave any questions:)
Trade safely
Bullish flag breakout generally moves the same ammount as the move before, in this case BTC jumped about 8%, so therefore we can expect another 8% jump if the H4 candle closes above the resistance line (Line 1).
I hope this helps, even if it doesn't play out.
Please leave any questions:)
Trade safely
ノート
Couldn't figure out how to attach photos so heres the link to what a bullish rectangle pattern looks like: luckscout.com/wp-content/uploads/2021/03/Rectangle-Chart-Pattern-1024x705.jpg
免責事項
これらの情報および投稿は、TradingViewが提供または承認する金融、投資、取引、またはその他の種類の助言もしくは推奨であることを意図したものではなく、またこれらに該当するものでもありません。詳細は利用規約をご覧ください。
免責事項
これらの情報および投稿は、TradingViewが提供または承認する金融、投資、取引、またはその他の種類の助言もしくは推奨であることを意図したものではなく、またこれらに該当するものでもありません。詳細は利用規約をご覧ください。