
Bitcoin (BTC/USDT) Analysis:
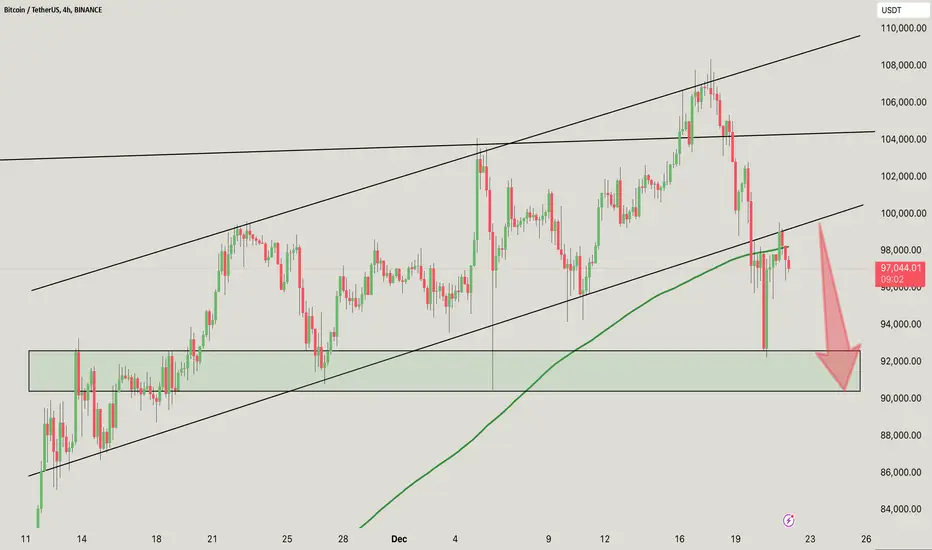
The green box marks a crucial support level between $90,000 and $92,500.
Historically, this area has acted as a strong demand zone where buyers have stepped in to increase prices.
The price has broken below the mid-boundary of the ascending channel and is currently trading near the lower boundary.
A retest of the green box is possible if the bearish momentum persists.
The green moving average (possibly 200 EMA or similar) is slightly above the current price. This suggests that the price is losing upward momentum and the moving average could act as resistance on any bounce.
The red arrow on the chart indicates a possible move downwards towards the green support zone.
DYOR, NFA
@Peter_CSAdmin
The green box marks a crucial support level between $90,000 and $92,500.
Historically, this area has acted as a strong demand zone where buyers have stepped in to increase prices.
The price has broken below the mid-boundary of the ascending channel and is currently trading near the lower boundary.
A retest of the green box is possible if the bearish momentum persists.
The green moving average (possibly 200 EMA or similar) is slightly above the current price. This suggests that the price is losing upward momentum and the moving average could act as resistance on any bounce.
The red arrow on the chart indicates a possible move downwards towards the green support zone.
DYOR, NFA
@Peter_CSAdmin

関連の投稿
免責事項
これらの情報および投稿は、TradingViewが提供または承認する金融、投資、取引、またはその他の種類の助言もしくは推奨であることを意図したものではなく、またこれらに該当するものでもありません。詳細は利用規約をご覧ください。
関連の投稿
免責事項
これらの情報および投稿は、TradingViewが提供または承認する金融、投資、取引、またはその他の種類の助言もしくは推奨であることを意図したものではなく、またこれらに該当するものでもありません。詳細は利用規約をご覧ください。