
#BTC UPDATE
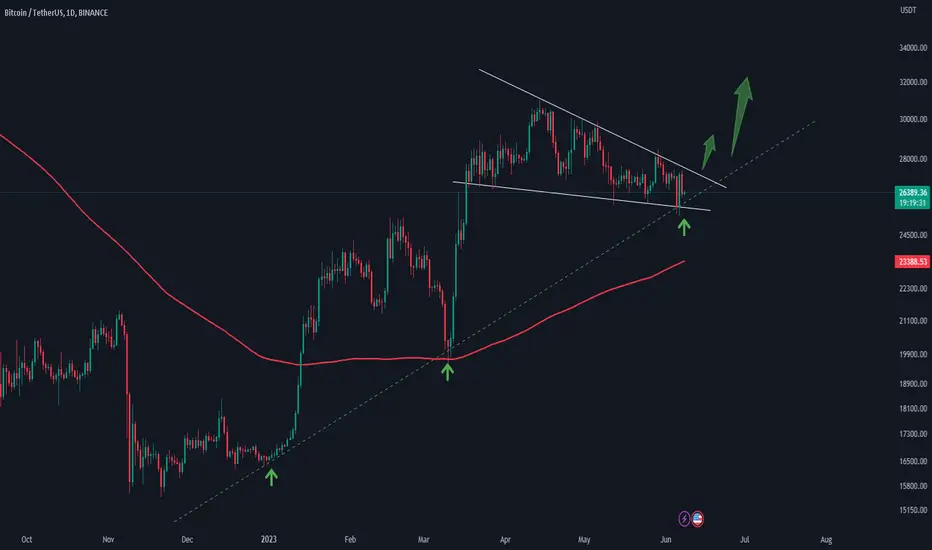
On the daily timeframe chart, #BTC is still advancing inside the wedge pattern and is currently situated above a major trendline.
A potential bullish rally of about +20–25% might be anticipated if Bitcoin maintains its position above the trendline and successfully breaks out from the wedge to the upside.
However, a bearish rally towards 21.5k may materialize if Bitcoin loses the support of the major trendline.
Significant volatility is anticipated next week because of the US CPI and FOMC schedules.
For more quality Charts analysis, follow us.
I'm grateful.
On the daily timeframe chart, #BTC is still advancing inside the wedge pattern and is currently situated above a major trendline.
A potential bullish rally of about +20–25% might be anticipated if Bitcoin maintains its position above the trendline and successfully breaks out from the wedge to the upside.
However, a bearish rally towards 21.5k may materialize if Bitcoin loses the support of the major trendline.
Significant volatility is anticipated next week because of the US CPI and FOMC schedules.
For more quality Charts analysis, follow us.
I'm grateful.
ノート
ノート
Still treading inside the wedge
ノート
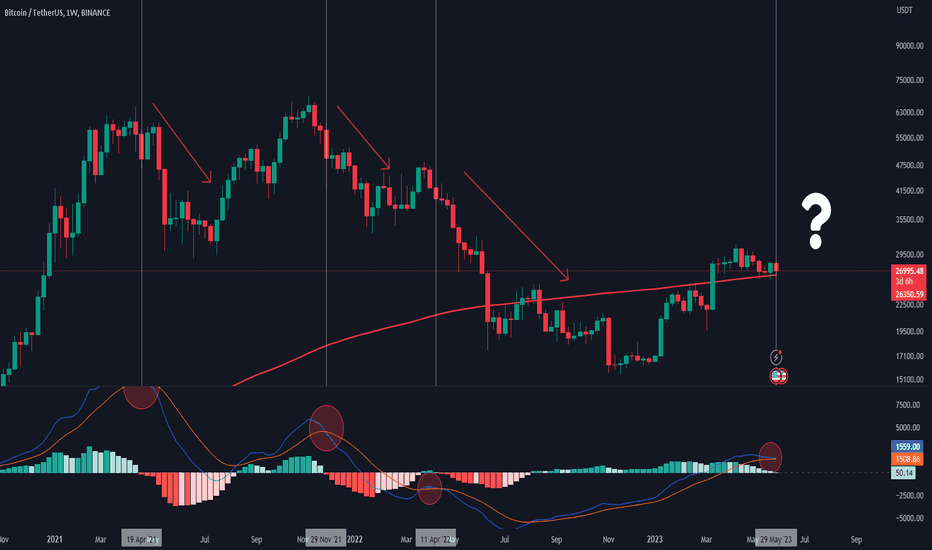
Bitcoin Holding 200 MA in the weekly timeframe
ノート
#BTC UPDATE
BTC is now staying above its support trendline and moving in a falling wedge on the 12H TF. The oversold level of the RSI is printing positive divergence.
The positive confirmation would be a bounce from here and a breakout of the falling wedge and the Ichimoku cloud. A further correction is also anticipated in the event of a substantial breakdown of the falling wedge.
ノート
Still treading at the same level
ノート
#BTC
BTC is maintaining above its support trendline while consolidating in a falling wedge. The oversold level of the RSI is printing positive divergence. Resistance is being provided by the MA 100 and the Ichimoku Cloud.
For as long it trades inside the falling wedge, a comeback is anticipated; but, a strong breakout or breakdown would indicate the market's next course of action.
ノート
IN A WEEKLY TIME FRAME, THE WORST SCENARIO
ノート
#BTCBTC is continuing to trade above both the horizontal support and the strong rising trendline. A bounce from here and a strong breach of the descending trendline would serve as bullish confirmation.
A further correction in the market is also anticipated if the rising trendline and the horizontal support are consistently broken.
ノート
From the trendline and horizontal support, BTC nicely rebounded. There is a bullish divergence at work. Resistance is being provided by the declining trendline and the MA 50. A significant bullish rally in the market would be confirmed by a breach of the descending trendline and MA 50.
ノート
#BTCBTC is seeking to break through the MA 50 and the declining trendline. The oversold area of the RSI is being bounced out of, and bullish divergence is printing. MACD crossover is moving more bullishly.
A strong breakout of the descending trendline or a test of the horizontal or ascending trendline support in the event of rejection would signal a respectable bullish rally in the market.

Register on weex and trade with me: 👇
weex.com/en/register?vipCode=cryptomojo
Get CRYPTOMOJO premium for free 👉 ple8x3.s.gy/CRYPTOMOJO
weex.com/en/register?vipCode=cryptomojo
Get CRYPTOMOJO premium for free 👉 ple8x3.s.gy/CRYPTOMOJO
関連の投稿
免責事項
これらの情報および投稿は、TradingViewが提供または承認する金融、投資、取引、またはその他の種類の助言もしくは推奨であることを意図したものではなく、またこれらに該当するものでもありません。詳細は利用規約をご覧ください。
Register on weex and trade with me: 👇
weex.com/en/register?vipCode=cryptomojo
Get CRYPTOMOJO premium for free 👉 ple8x3.s.gy/CRYPTOMOJO
weex.com/en/register?vipCode=cryptomojo
Get CRYPTOMOJO premium for free 👉 ple8x3.s.gy/CRYPTOMOJO
関連の投稿
免責事項
これらの情報および投稿は、TradingViewが提供または承認する金融、投資、取引、またはその他の種類の助言もしくは推奨であることを意図したものではなく、またこれらに該当するものでもありません。詳細は利用規約をご覧ください。