
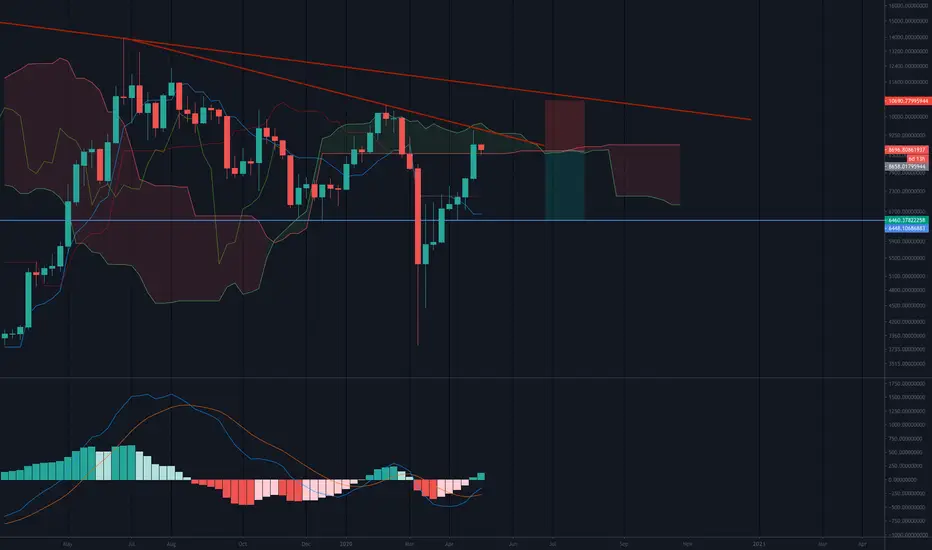
- The past 7 weeks have been green candles fully recovering from the big drop in early March.
- Price is now testing resistance against a downwards trendline
- While MACD is up, Ichimoku Cloud indicator suggests downwards pressure. Price is inside the cloud, suggesting lack of clear direction. Cloud future is red suggesting bear sentiment. Tenkan-san line (blue MA) is below the Kijun-san line (red MA) also suggesting bear sentiment.
...yet the monthly closed very bullish:
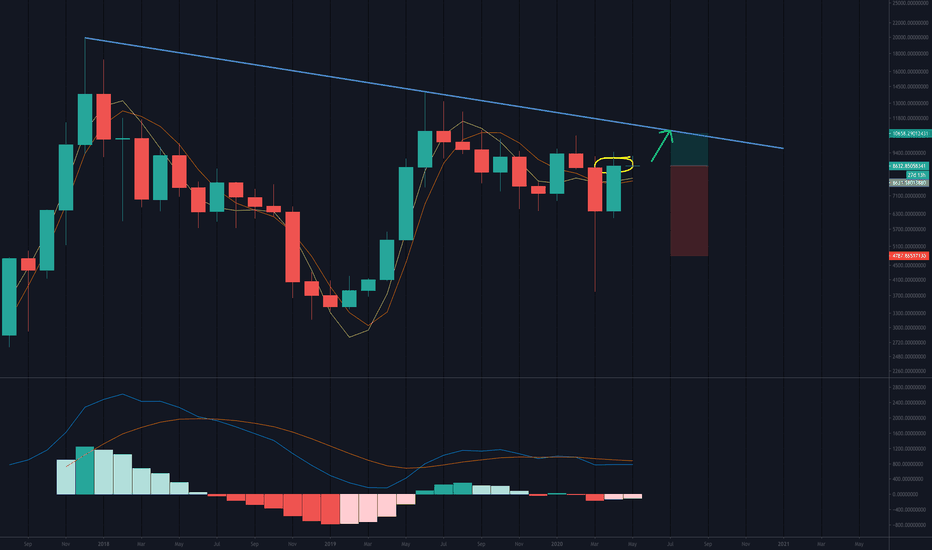
With strong support some 25% lower than current price, and halving taking place next week, we watch and wait...
Best guess at this point: price drops in first half of May's candle and then recovers to close near its high, ready for an April rally.
User our backtesting tool to help decide exact entry and exit points.

免責事項
これらの情報および投稿は、TradingViewが提供または承認する金融、投資、取引、またはその他の種類の助言もしくは推奨であることを意図したものではなく、またこれらに該当するものでもありません。詳細は利用規約をご覧ください。
免責事項
これらの情報および投稿は、TradingViewが提供または承認する金融、投資、取引、またはその他の種類の助言もしくは推奨であることを意図したものではなく、またこれらに該当するものでもありません。詳細は利用規約をご覧ください。