
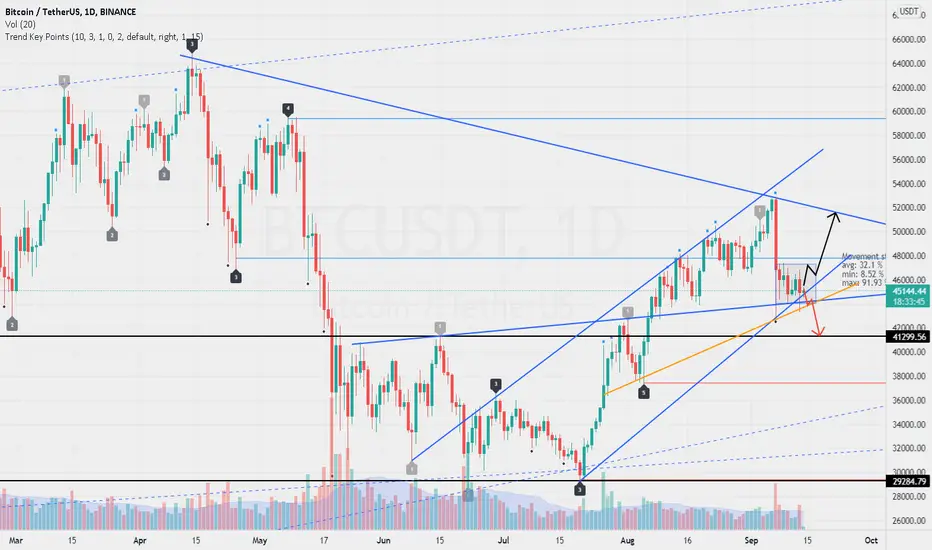
$44k is the most important support near. Its breakdown could pull the price around $41k.
The rectangle is drawn on the 1-hour time frame, I expect it to break upwards with a resistance. If so, the next stop will be between $50k and $51k.
Trend Key Points Indicator have been used to draw important key levels and key points.
The rectangle is drawn on the 1-hour time frame, I expect it to break upwards with a resistance. If so, the next stop will be between $50k and $51k.
Trend Key Points Indicator have been used to draw important key levels and key points.

関連の投稿
免責事項
これらの情報および投稿は、TradingViewが提供または承認する金融、投資、取引、またはその他の種類の助言もしくは推奨であることを意図したものではなく、またこれらに該当するものでもありません。詳細は利用規約をご覧ください。
免責事項
これらの情報および投稿は、TradingViewが提供または承認する金融、投資、取引、またはその他の種類の助言もしくは推奨であることを意図したものではなく、またこれらに該当するものでもありません。詳細は利用規約をご覧ください。