
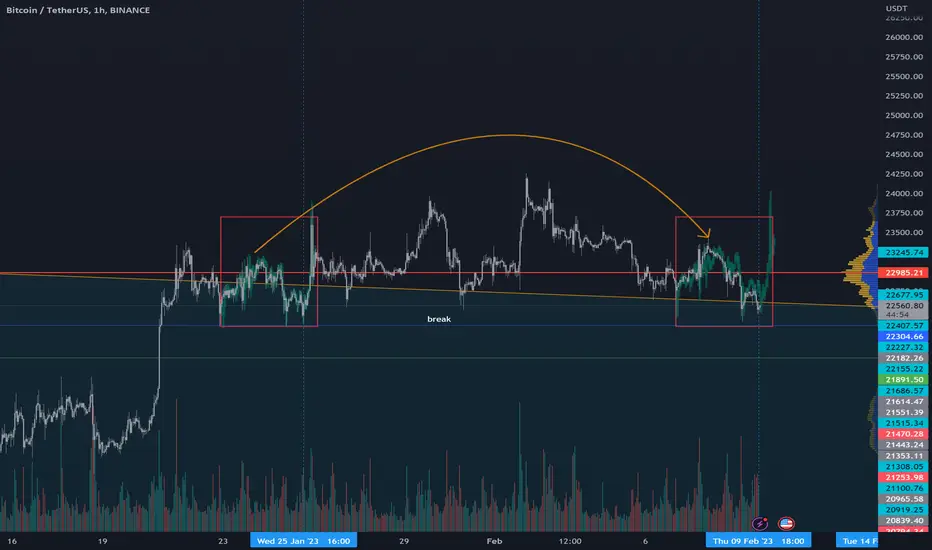
Nothing spectacular happening until the 14th Feb in fundamental terms. Despite the fact that we look like we hit the potential top of this range multiple times we can see a pattern happening.
The pattern in the chart is not bullish it can just confirm the range, the possible outcome when exiting the range still has bearish chances.
Conclusion: Pattern can repeat itself, and can be invalidated on the blue line at $22.304. If that point is broken we have thin air until the previous range.
The pattern in the chart is not bullish it can just confirm the range, the possible outcome when exiting the range still has bearish chances.
Conclusion: Pattern can repeat itself, and can be invalidated on the blue line at $22.304. If that point is broken we have thin air until the previous range.

Join our free telegram community here: t.me/sublimetraders
Our website: sublimetraders.com/
Proudly listed on binance-futures-signals.com/
GET Lorentzian ML access - bit.ly/Lorentzian
Our website: sublimetraders.com/
Proudly listed on binance-futures-signals.com/
GET Lorentzian ML access - bit.ly/Lorentzian
免責事項
これらの情報および投稿は、TradingViewが提供または承認する金融、投資、取引、またはその他の種類の助言もしくは推奨であることを意図したものではなく、またこれらに該当するものでもありません。詳細は利用規約をご覧ください。
Join our free telegram community here: t.me/sublimetraders
Our website: sublimetraders.com/
Proudly listed on binance-futures-signals.com/
GET Lorentzian ML access - bit.ly/Lorentzian
Our website: sublimetraders.com/
Proudly listed on binance-futures-signals.com/
GET Lorentzian ML access - bit.ly/Lorentzian
免責事項
これらの情報および投稿は、TradingViewが提供または承認する金融、投資、取引、またはその他の種類の助言もしくは推奨であることを意図したものではなく、またこれらに該当するものでもありません。詳細は利用規約をご覧ください。