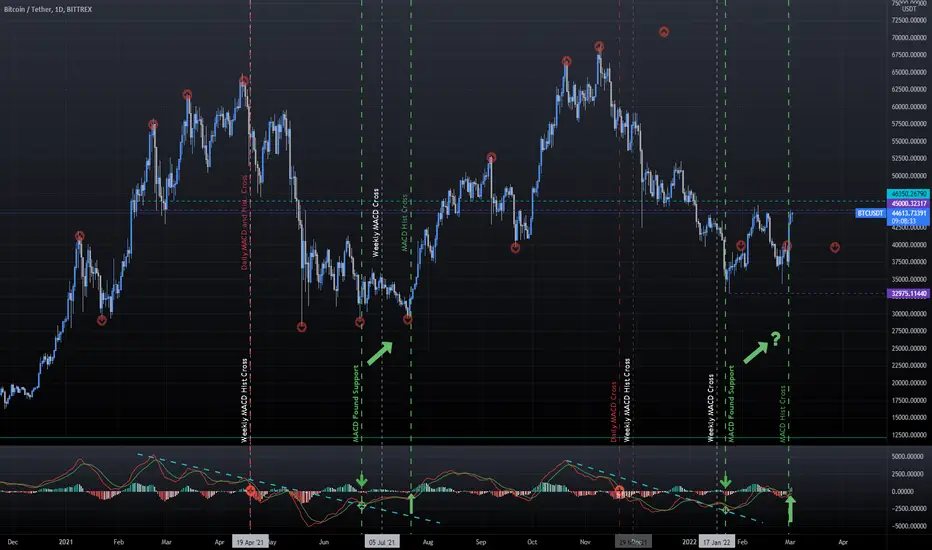
It seems history is repeating.
Weekly MACD histogram and daily MACD and histogram crossing negative preceded the crash in May. Daily MACD finding support, followed by the histogram crossing positive marked the start of the rally in August.
The same sequence of events has just completed in the last few days. Time for a bull run?
Weekly MACD histogram and daily MACD and histogram crossing negative preceded the crash in May. Daily MACD finding support, followed by the histogram crossing positive marked the start of the rally in August.
The same sequence of events has just completed in the last few days. Time for a bull run?

免責事項
これらの情報および投稿は、TradingViewが提供または承認する金融、投資、取引、またはその他の種類の助言もしくは推奨であることを意図したものではなく、またこれらに該当するものでもありません。詳細は利用規約をご覧ください。
免責事項
これらの情報および投稿は、TradingViewが提供または承認する金融、投資、取引、またはその他の種類の助言もしくは推奨であることを意図したものではなく、またこれらに該当するものでもありません。詳細は利用規約をご覧ください。