
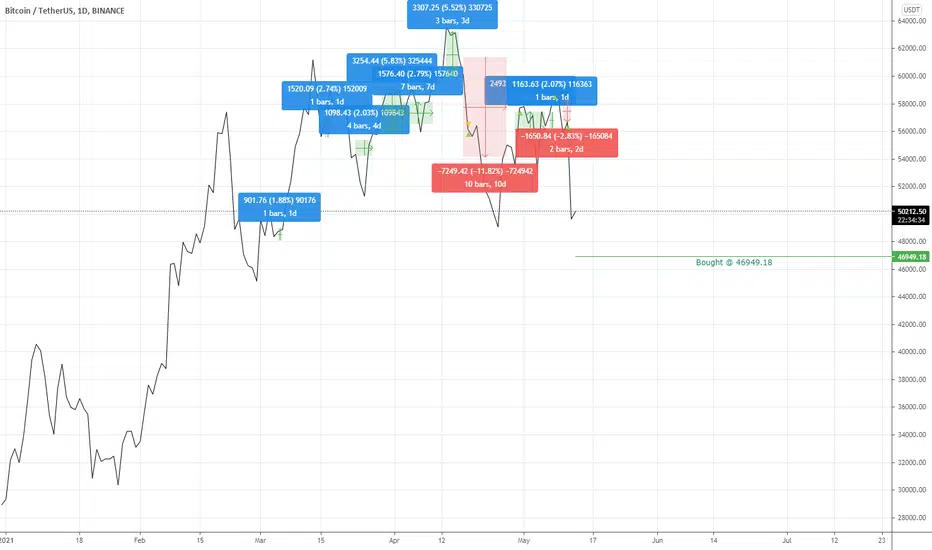
13 May 2021. AI is predicting that the close of 12 May 2021 will be a bottom and has purchased during the opening. Looks like there was a "flash crash" and the filled price was at 46949.18. This is quite far from the closing price.
The candlestick chart shows the spike.

Previous boxes show past trade results.
The candlestick chart shows the spike.
Previous boxes show past trade results.
ノート
14 May 2021. Bottom called correctly but not a significant spike.ノート
15 May 2021. Still holding on to the position.ノート
17 May 2021. Still holding.ノート
18 May 2021. Still holding.ノート
19 May 2021. This may turn out to be a big loss. I'm thinking if the trading strategy should change from a single position to cost averaging. I'll see how it performs historically.トレード終了: ストップロスに到達
Finally sold at 39010.42 with a 15% loss. I actually retrained my model at it seems now to manage the previous crash better based on backtesting.
免責事項
これらの情報および投稿は、TradingViewが提供または承認する金融、投資、取引、またはその他の種類の助言もしくは推奨であることを意図したものではなく、またこれらに該当するものでもありません。詳細は利用規約をご覧ください。
免責事項
これらの情報および投稿は、TradingViewが提供または承認する金融、投資、取引、またはその他の種類の助言もしくは推奨であることを意図したものではなく、またこれらに該当するものでもありません。詳細は利用規約をご覧ください。