
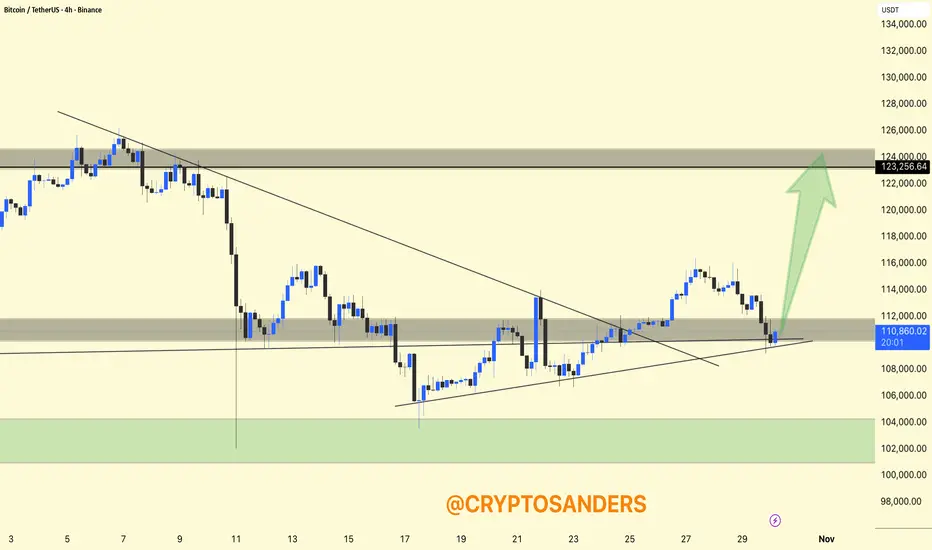
BTCUSDT 4-Hour Chart Analysis
Support and Trend: BTC has bounced off the ascending trendline and is currently holding above the $110,000-$111,000 support area (represented by the gray band). The price is respecting both diagonal trendline support and horizontal support, which is a positive sign for bullish momentum.
Key Levels: Immediate resistance is at $112,000-$113,000. A clear break above this area could create room for further growth towards the next major resistance at $123,250-$124,000 (marked at the top).
Outlook: As indicated by the green arrow, the chart suggests a bullish scenario if this area holds, with the potential for upward acceleration towards the $123,000 area.
DYOR | NFA
Support and Trend: BTC has bounced off the ascending trendline and is currently holding above the $110,000-$111,000 support area (represented by the gray band). The price is respecting both diagonal trendline support and horizontal support, which is a positive sign for bullish momentum.
Key Levels: Immediate resistance is at $112,000-$113,000. A clear break above this area could create room for further growth towards the next major resistance at $123,250-$124,000 (marked at the top).
Outlook: As indicated by the green arrow, the chart suggests a bullish scenario if this area holds, with the potential for upward acceleration towards the $123,000 area.
DYOR | NFA

関連の投稿
免責事項
これらの情報および投稿は、TradingViewが提供または承認する金融、投資、取引、またはその他の種類の助言もしくは推奨であることを意図したものではなく、またこれらに該当するものでもありません。詳細は利用規約をご覧ください。
関連の投稿
免責事項
これらの情報および投稿は、TradingViewが提供または承認する金融、投資、取引、またはその他の種類の助言もしくは推奨であることを意図したものではなく、またこれらに該当するものでもありません。詳細は利用規約をご覧ください。