
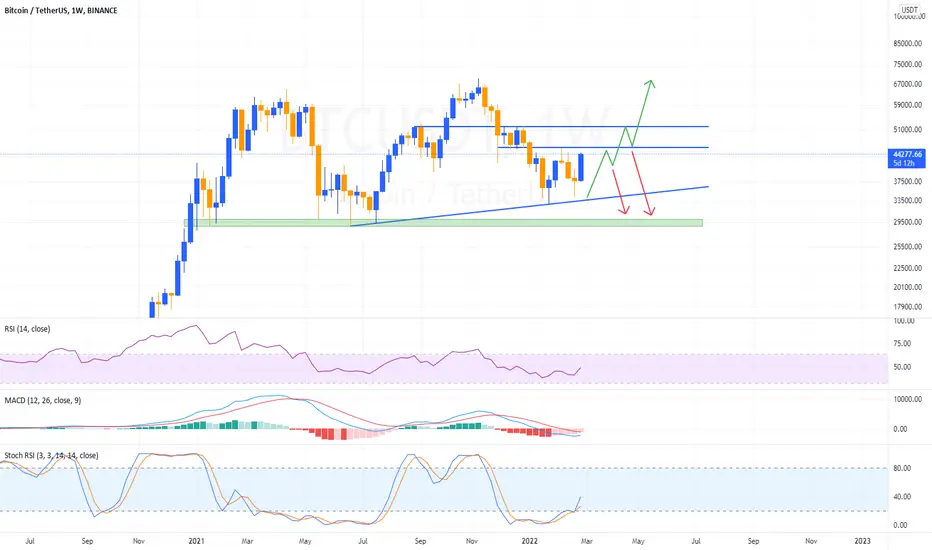
Bitcoin has been showing big volatility last two month becuase of FED interest speculation and Russia vs Ukraine crisis. But weekly chart still bullish and indicates BTC can have a big rally in next 12-16 weeks. RSI showing bullish divergence, MACD showing low sell pressure like June 20221 and stock RSI indicate market can give bounce with short term noise.
First resistance on W1 chart is $45k then $53k while support is at $36k and $29k.
Try to understand chart and trade between the lines.
Major events: Russia/Ukraine and FED interest speculation.
Trade safely :)
First resistance on W1 chart is $45k then $53k while support is at $36k and $29k.
Try to understand chart and trade between the lines.
Major events: Russia/Ukraine and FED interest speculation.
Trade safely :)

免責事項
これらの情報および投稿は、TradingViewが提供または承認する金融、投資、取引、またはその他の種類の助言もしくは推奨であることを意図したものではなく、またこれらに該当するものでもありません。詳細は利用規約をご覧ください。
免責事項
これらの情報および投稿は、TradingViewが提供または承認する金融、投資、取引、またはその他の種類の助言もしくは推奨であることを意図したものではなく、またこれらに該当するものでもありません。詳細は利用規約をご覧ください。