
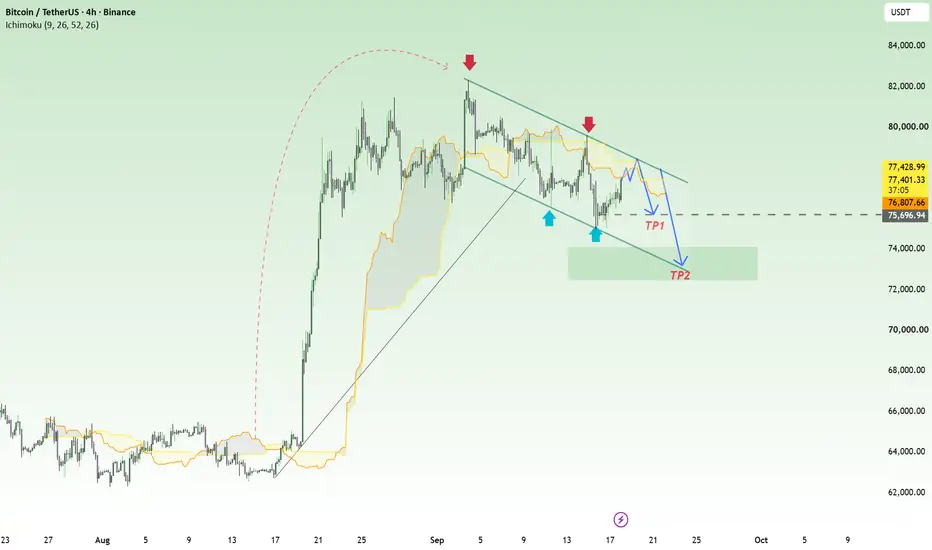
In my view, BTCUSDT remains tilted toward a bearish scenario in the short term, as macro pressure has not fully disappeared and the H4 structure remains contained within a descending channel.
From a fundamental perspective, the Fed has raised interest rates to 3.75%–4.00% and signaled that further tightening remains possible, an environment that can weigh on risk assets. At the same time, uncertainty surrounding U.S. crypto regulation continues to add pressure. However, easing Treasury yields and a recovery in U.S. equities are providing some support, meaning the bearish pressure is not entirely one-sided.
Looking at the H4 chart, BTC has recovered toward $77,445, but price has yet to break above the descending resistance line extending from the highs above $82,000. Recent rebounds have continued to form lower highs, while the $77,800–$78,500 area is becoming an important test for buyers.
My preferred scenario is for price to recover toward the upper boundary of the channel before sellers step back in. If BTC fails to break and hold above this resistance area, price could return to test $75,700. A clear break below this level could open the door for a deeper move toward $72,700–$74,000.
As long as the descending channel remains intact, I continue to favor bearish continuation, with $75,700 as the first downside target and $72,700–$74,000 as the next key area to watch.
From a fundamental perspective, the Fed has raised interest rates to 3.75%–4.00% and signaled that further tightening remains possible, an environment that can weigh on risk assets. At the same time, uncertainty surrounding U.S. crypto regulation continues to add pressure. However, easing Treasury yields and a recovery in U.S. equities are providing some support, meaning the bearish pressure is not entirely one-sided.
Looking at the H4 chart, BTC has recovered toward $77,445, but price has yet to break above the descending resistance line extending from the highs above $82,000. Recent rebounds have continued to form lower highs, while the $77,800–$78,500 area is becoming an important test for buyers.
My preferred scenario is for price to recover toward the upper boundary of the channel before sellers step back in. If BTC fails to break and hold above this resistance area, price could return to test $75,700. A clear break below this level could open the door for a deeper move toward $72,700–$74,000.
As long as the descending channel remains intact, I continue to favor bearish continuation, with $75,700 as the first downside target and $72,700–$74,000 as the next key area to watch.
トレード稼働中
注文をキャンセル

LEVEL UP YOUR TRADING
👉t.me/+-HowPr1J4k03NGY1
Signals & setups to boost your edge
Free trading plans to follow
Real-time market insights
👉t.me/+-HowPr1J4k03NGY1
Signals & setups to boost your edge
Free trading plans to follow
Real-time market insights
関連の投稿
免責事項
これらの情報および投稿は、TradingViewが提供または承認する金融、投資、取引、またはその他の種類の助言もしくは推奨であることを意図したものではなく、またこれらに該当するものでもありません。詳細は利用規約をご覧ください。
LEVEL UP YOUR TRADING
👉t.me/+-HowPr1J4k03NGY1
Signals & setups to boost your edge
Free trading plans to follow
Real-time market insights
👉t.me/+-HowPr1J4k03NGY1
Signals & setups to boost your edge
Free trading plans to follow
Real-time market insights
関連の投稿
免責事項
これらの情報および投稿は、TradingViewが提供または承認する金融、投資、取引、またはその他の種類の助言もしくは推奨であることを意図したものではなく、またこれらに該当するものでもありません。詳細は利用規約をご覧ください。