
👋 Welcome to TradeCityPro!
Let’s move on to the Bitcoin analysis, today the market is going through a correction.
⏳ 4-hour timeframe
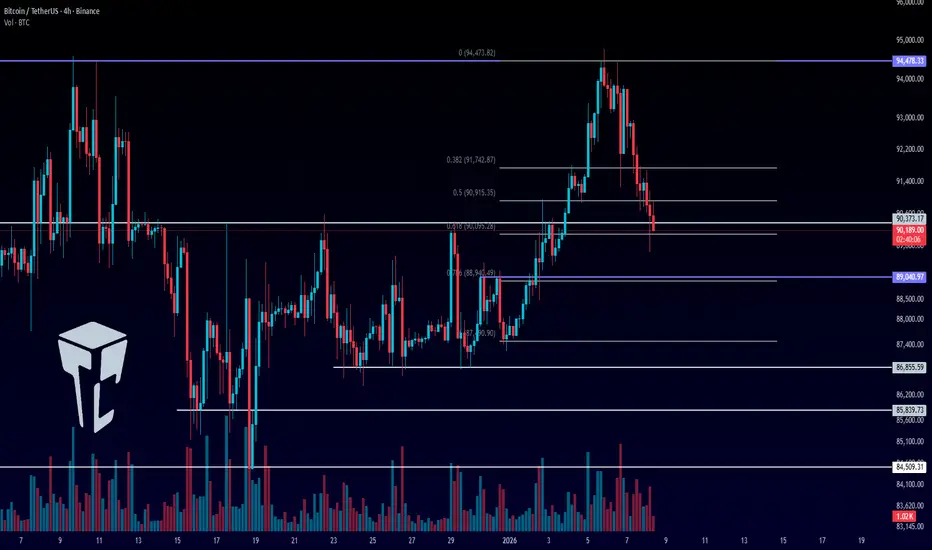
On the 4-hour timeframe, after Bitcoin reached the 94478 resistance, it entered a corrective phase and its bullish momentum decreased significantly.
✔️ In the first corrective leg, price retraced to the 0.382 Fibonacci level, and since then it has retraced down to the 0.618 level.
💥 The 0.618 Fibonacci area overlaps with 90373, forming a strong PRZ. If Bitcoin’s next bullish wave is going to start, price can build a bottom here and begin its upward move.
✨ If the correction extends further, the next support is 89040. If this level is also lost, price can move down toward the main low at 86855, in which case the entire bullish move we had so far becomes a fakeout.
🔔 If price finds support right here at 90373, we can open a long position after the structural break that Bitcoin creates. The main confirmation for the start of the next bullish wave will be the break of 94478.
🎲 For a short position, I will wait until price stabilizes below 90373, and then I will look for a trigger.
❌ Disclaimer ❌
Trading futures is highly risky and dangerous. If you're not an expert, these triggers may not be suitable for you. You should first learn risk and capital management. You can also use the educational content from this channel.
Finally, these triggers reflect my personal opinions on price action, and the market may move completely against this analysis. So, do your own research before opening any position.
Let’s move on to the Bitcoin analysis, today the market is going through a correction.
⏳ 4-hour timeframe
On the 4-hour timeframe, after Bitcoin reached the 94478 resistance, it entered a corrective phase and its bullish momentum decreased significantly.
✔️ In the first corrective leg, price retraced to the 0.382 Fibonacci level, and since then it has retraced down to the 0.618 level.
💥 The 0.618 Fibonacci area overlaps with 90373, forming a strong PRZ. If Bitcoin’s next bullish wave is going to start, price can build a bottom here and begin its upward move.
✨ If the correction extends further, the next support is 89040. If this level is also lost, price can move down toward the main low at 86855, in which case the entire bullish move we had so far becomes a fakeout.
🔔 If price finds support right here at 90373, we can open a long position after the structural break that Bitcoin creates. The main confirmation for the start of the next bullish wave will be the break of 94478.
🎲 For a short position, I will wait until price stabilizes below 90373, and then I will look for a trigger.
❌ Disclaimer ❌
Trading futures is highly risky and dangerous. If you're not an expert, these triggers may not be suitable for you. You should first learn risk and capital management. You can also use the educational content from this channel.
Finally, these triggers reflect my personal opinions on price action, and the market may move completely against this analysis. So, do your own research before opening any position.

💥 Don’t Miss Out!
🏆 Trade & Earn : bitunix.com/register?vipCode=TCPINT
💰 Join the Telegram Channel Now: t.me/Tradecityproint
🤵 Business Contact: Tradecityproteam@gmail.com
🏆 Trade & Earn : bitunix.com/register?vipCode=TCPINT
💰 Join the Telegram Channel Now: t.me/Tradecityproint
🤵 Business Contact: Tradecityproteam@gmail.com
免責事項
これらの情報および投稿は、TradingViewが提供または承認する金融、投資、取引、またはその他の種類の助言もしくは推奨であることを意図したものではなく、またこれらに該当するものでもありません。詳細は利用規約をご覧ください。
💥 Don’t Miss Out!
🏆 Trade & Earn : bitunix.com/register?vipCode=TCPINT
💰 Join the Telegram Channel Now: t.me/Tradecityproint
🤵 Business Contact: Tradecityproteam@gmail.com
🏆 Trade & Earn : bitunix.com/register?vipCode=TCPINT
💰 Join the Telegram Channel Now: t.me/Tradecityproint
🤵 Business Contact: Tradecityproteam@gmail.com
免責事項
これらの情報および投稿は、TradingViewが提供または承認する金融、投資、取引、またはその他の種類の助言もしくは推奨であることを意図したものではなく、またこれらに該当するものでもありません。詳細は利用規約をご覧ください。