
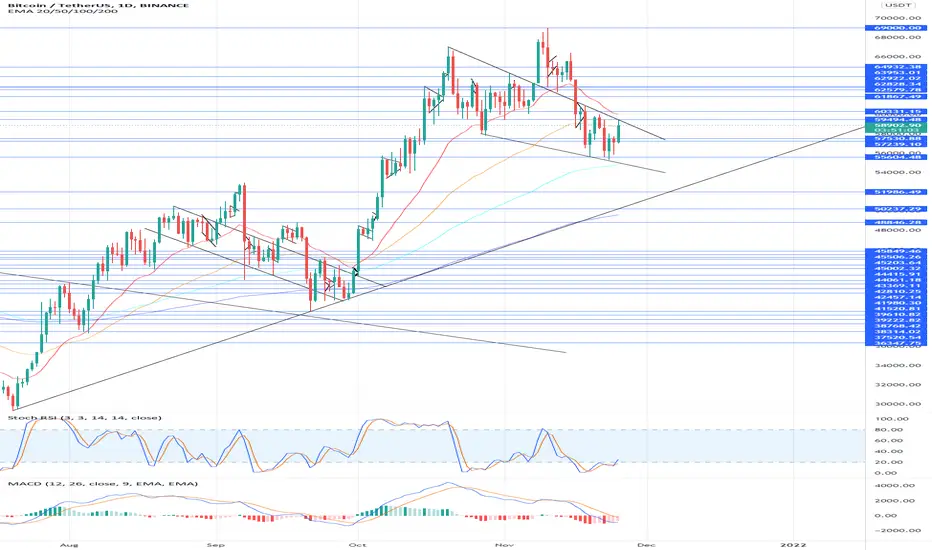
By taking a trend line from the beginning (20th July) of the current wave up along the previous correction low (21st September), we can visualize a trailing price of support.
Bitcoin is trading in a falling wedge, while the MACD approaches a crossover. If there is sufficient momentum to push the MACD above 0 following a cross-over (price action to the upside occurs), a more prolonged move to the upside may be expected.
The MACD is looking very similar to the beginning of the last wave up.
Lastly, the stochastic RSI informs us that the price is OVERSOLD, which holds great significance on the daily charts, and we may be approaching a state of being OVERBOUGHT in the very near-future.
The trend is your friend! Personally I think a 3 Trillion TOTAL CRYPTO Market CAP is realistic soon, so I can expect bitcoin to progress towards the $70,000 in the near future.
This is not financial advice.
Thanks!
Bitcoin is trading in a falling wedge, while the MACD approaches a crossover. If there is sufficient momentum to push the MACD above 0 following a cross-over (price action to the upside occurs), a more prolonged move to the upside may be expected.
The MACD is looking very similar to the beginning of the last wave up.
Lastly, the stochastic RSI informs us that the price is OVERSOLD, which holds great significance on the daily charts, and we may be approaching a state of being OVERBOUGHT in the very near-future.
The trend is your friend! Personally I think a 3 Trillion TOTAL CRYPTO Market CAP is realistic soon, so I can expect bitcoin to progress towards the $70,000 in the near future.
This is not financial advice.
Thanks!

免責事項
これらの情報および投稿は、TradingViewが提供または承認する金融、投資、取引、またはその他の種類の助言もしくは推奨であることを意図したものではなく、またこれらに該当するものでもありません。詳細は利用規約をご覧ください。
免責事項
これらの情報および投稿は、TradingViewが提供または承認する金融、投資、取引、またはその他の種類の助言もしくは推奨であることを意図したものではなく、またこれらに該当するものでもありません。詳細は利用規約をご覧ください。