
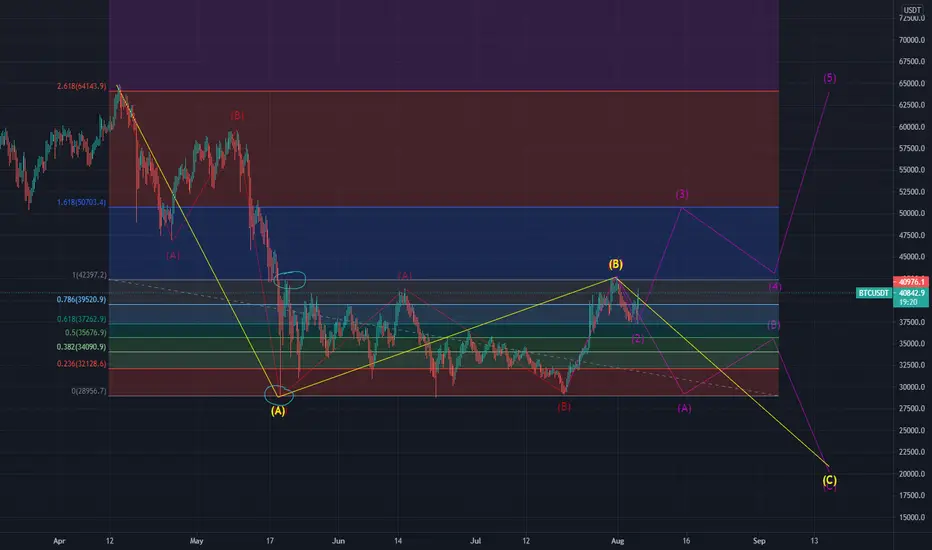
Interesting to see how the 2.618 length based on the blue circles, the second red A wave's size places it just under old ATH...
You also may notice that it just bounced off the same .618 retrace level that I'm using to define that potential price move.
However, the length does not work in tune to my old post tagged below, as the "size" of the A wave starting after may 19th actually finishes around 44,900, placing the 2.618 higher than 64,000.
You also may notice that it just bounced off the same .618 retrace level that I'm using to define that potential price move.
However, the length does not work in tune to my old post tagged below, as the "size" of the A wave starting after may 19th actually finishes around 44,900, placing the 2.618 higher than 64,000.
ノート
In my previous post, I drew on the Bittrex exchange, as it actually goes back much further in the past for btc dataノート
purple ABC should be red lolノート
my Bollinger bands paired with RSI, Ichimoku means if we break BELOW 40,618 then this is a throw over before a 15,000$ drop!!!ノート
so wave 5? or done? it bounced on w 1ノート
Purple wave 5 complete
関連の投稿
免責事項
これらの情報および投稿は、TradingViewが提供または承認する金融、投資、取引、またはその他の種類の助言もしくは推奨であることを意図したものではなく、またこれらに該当するものでもありません。詳細は利用規約をご覧ください。
免責事項
これらの情報および投稿は、TradingViewが提供または承認する金融、投資、取引、またはその他の種類の助言もしくは推奨であることを意図したものではなく、またこれらに該当するものでもありません。詳細は利用規約をご覧ください。