
 BTCUSDT
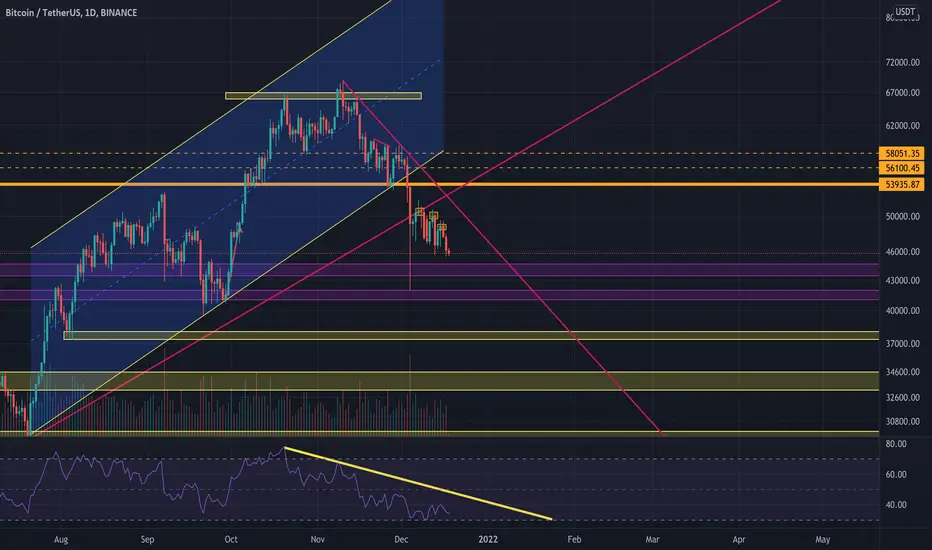
Well the daily analysis of BTCUSDT shows that still we are in a down trend.
some Technical facts
RSI is in down trend
price movement is in downtrend reacted to dynamic resistance and we have lower high as you can see in chart
we are close to 44500-43500 and if it loose this one, we are about to go for 41000 area.
and if we loose that too for sure we are going to touch 38000 but I do think that happens in my personal opinion, because of RSI position.
we don't have any sign for break or trend change yet.
This analysis is a possibility and might fail due to market fluctuations.

関連の投稿
免責事項
これらの情報および投稿は、TradingViewが提供または承認する金融、投資、取引、またはその他の種類の助言もしくは推奨であることを意図したものではなく、またこれらに該当するものでもありません。詳細は利用規約をご覧ください。
免責事項
これらの情報および投稿は、TradingViewが提供または承認する金融、投資、取引、またはその他の種類の助言もしくは推奨であることを意図したものではなく、またこれらに該当するものでもありません。詳細は利用規約をご覧ください。