
Attention Traders,
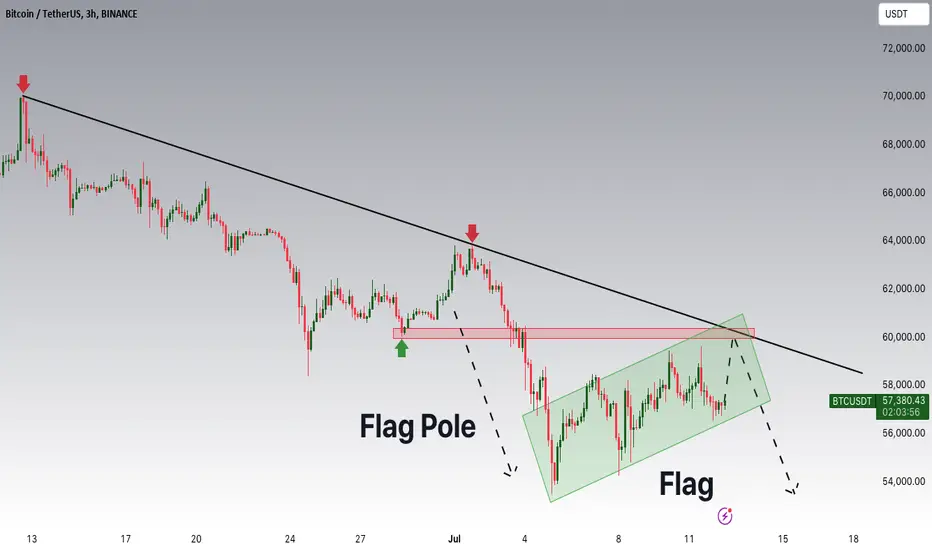
In today's trading session, we are closely monitoring BTC/USDT for a potential selling opportunity around the $59,800 zone. Currently, Bitcoin is exhibiting a downtrend, and it is in a correction phase. This phase is bringing it toward a significant support and resistance area at $59,800.
Technical Analysis:
Trend Analysis: Bitcoin has been trending downward for the past few sessions. The prevailing downtrend suggests a bearish market sentiment, with sellers maintaining control. The approach to the $59,800 zone is critical, as this area has previously acted as both support and resistance.
Bear Flag Formation: On smaller timeframes, Bitcoin has formed a bear flag pattern, which is a continuation pattern indicating potential further declines. The price is currently approaching the upper boundary of this flag, which coincides with the downtrend resistance.
Key Indicators:
Moving Averages: The 50-day moving average is trending below the 200-day moving average, reinforcing the bearish outlook.
Relative Strength Index (RSI): The RSI is hovering around the 40-50 range, suggesting a lack of bullish momentum and a potential for further downside.
Volume: Recent trading volumes have been decreasing, indicating that the corrective rally lacks strength and could reverse upon hitting significant resistance.
Trade safe, Joe.
In today's trading session, we are closely monitoring BTC/USDT for a potential selling opportunity around the $59,800 zone. Currently, Bitcoin is exhibiting a downtrend, and it is in a correction phase. This phase is bringing it toward a significant support and resistance area at $59,800.
Technical Analysis:
Trend Analysis: Bitcoin has been trending downward for the past few sessions. The prevailing downtrend suggests a bearish market sentiment, with sellers maintaining control. The approach to the $59,800 zone is critical, as this area has previously acted as both support and resistance.
Bear Flag Formation: On smaller timeframes, Bitcoin has formed a bear flag pattern, which is a continuation pattern indicating potential further declines. The price is currently approaching the upper boundary of this flag, which coincides with the downtrend resistance.
Key Indicators:
Moving Averages: The 50-day moving average is trending below the 200-day moving average, reinforcing the bearish outlook.
Relative Strength Index (RSI): The RSI is hovering around the 40-50 range, suggesting a lack of bullish momentum and a potential for further downside.
Volume: Recent trading volumes have been decreasing, indicating that the corrective rally lacks strength and could reverse upon hitting significant resistance.
Trade safe, Joe.
ノート
Germany has now under $285 million worth of Bitcoin left to sellノート
Bitcoin is above 58k now, heading towards the trend!ノート
Germany's government sells off all of its Bitcoin holdings, worth $2.9 billion.ノート
Bitcoin have reached the trendトレード稼働中

Free Telegram Group:
t.me/+0LGgMsgX9TViOGZk
The 1% Traders Club:
t.me/+dMaf68BK5c5hZDA8
t.me/+0LGgMsgX9TViOGZk
The 1% Traders Club:
t.me/+dMaf68BK5c5hZDA8
免責事項
これらの情報および投稿は、TradingViewが提供または承認する金融、投資、取引、またはその他の種類の助言もしくは推奨であることを意図したものではなく、またこれらに該当するものでもありません。詳細は利用規約をご覧ください。
Free Telegram Group:
t.me/+0LGgMsgX9TViOGZk
The 1% Traders Club:
t.me/+dMaf68BK5c5hZDA8
t.me/+0LGgMsgX9TViOGZk
The 1% Traders Club:
t.me/+dMaf68BK5c5hZDA8
免責事項
これらの情報および投稿は、TradingViewが提供または承認する金融、投資、取引、またはその他の種類の助言もしくは推奨であることを意図したものではなく、またこれらに該当するものでもありません。詳細は利用規約をご覧ください。