
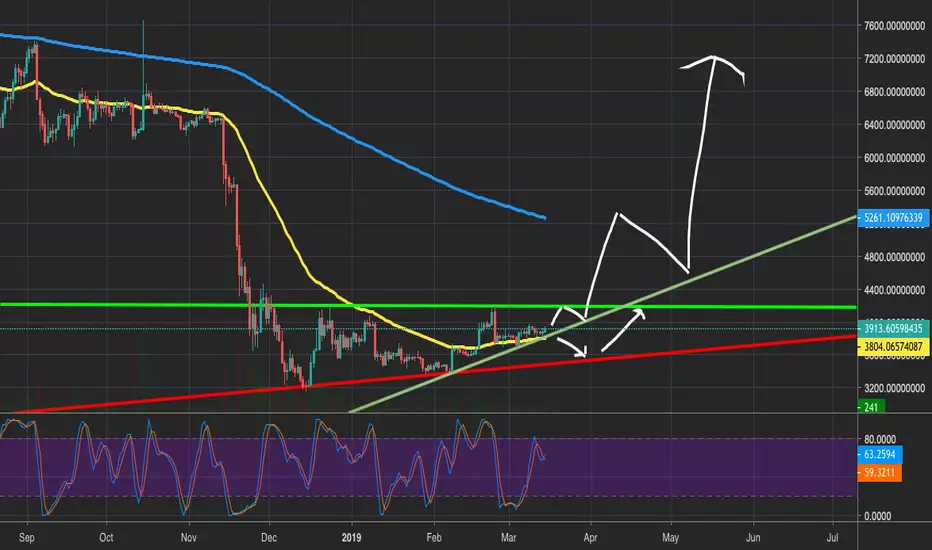
Yellow = 50 EMA
Blue = 300 EMA
After it break the vertical line at $4198. It wil most likely test the 300EMA which is the same as 50EMA on the weekly chart. On the weekly chart, the Stochastic RSI is getting to overbought levels, which is worrying, so we might see a correction soon. We have to wait and see what will happen.
Blue = 300 EMA
After it break the vertical line at $4198. It wil most likely test the 300EMA which is the same as 50EMA on the weekly chart. On the weekly chart, the Stochastic RSI is getting to overbought levels, which is worrying, so we might see a correction soon. We have to wait and see what will happen.

免責事項
これらの情報および投稿は、TradingViewが提供または承認する金融、投資、取引、またはその他の種類の助言もしくは推奨であることを意図したものではなく、またこれらに該当するものでもありません。詳細は利用規約をご覧ください。
免責事項
これらの情報および投稿は、TradingViewが提供または承認する金融、投資、取引、またはその他の種類の助言もしくは推奨であることを意図したものではなく、またこれらに該当するものでもありません。詳細は利用規約をご覧ください。