
Hi guys, This is CryptoMojo, One of the most active trading view authors and fastest-growing communities.
Consider following me for the latest updates and Long /Short calls on almost every exchange.
I post short mid and long-term trade setups too.
Let’s get to the chart!
I have tried my best to bring the best possible outcome to this chart, Do not consider it as financial advice.
#BTC/USDT ANALYSIS
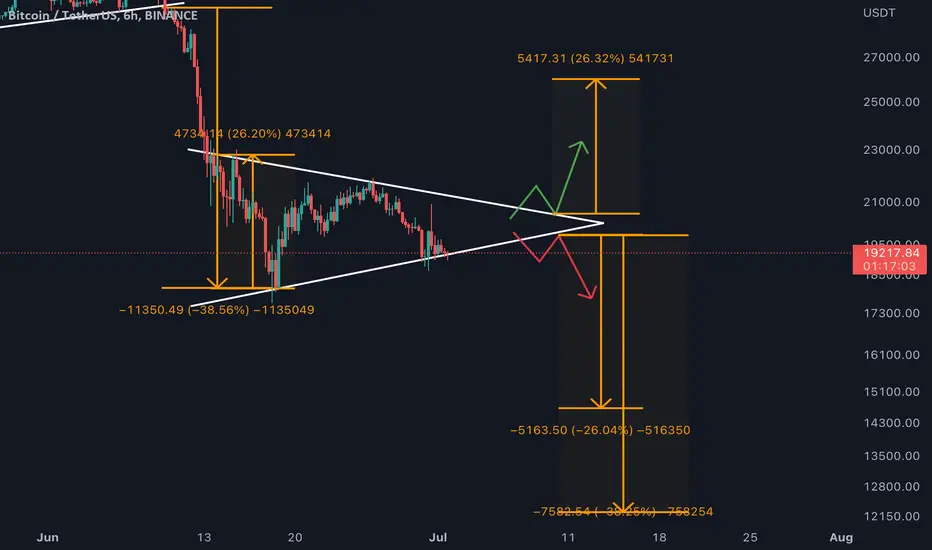
BTC is making these two patterns in which one is bearish and one is bullish.
BTC is forming bearish pannent in 6hr timeframe
If pannent broken downside then is ready for another 30% bearish wave.
Let’s look at the bullish scenario BTC is also forming a symmetrical triangle pattern which is bearish and bullish both depending on the breakout or breakdown.
In this case, if BTC breakout this triangle pattern then we can expect a 25% bounce or the same as break down.
So let’s wait for a sustain break down or breakout will confirm the next the move of BTC .
Let's see how the market will react in few hours.
Stay tuned
This chart is likely to help you make better trade decisions if it does consider upvoting it.
I would also love to know your charts and views in the comment section.
Thank you
Consider following me for the latest updates and Long /Short calls on almost every exchange.
I post short mid and long-term trade setups too.
Let’s get to the chart!
I have tried my best to bring the best possible outcome to this chart, Do not consider it as financial advice.
#BTC/USDT ANALYSIS
BTC is making these two patterns in which one is bearish and one is bullish.
BTC is forming bearish pannent in 6hr timeframe
If pannent broken downside then is ready for another 30% bearish wave.
Let’s look at the bullish scenario BTC is also forming a symmetrical triangle pattern which is bearish and bullish both depending on the breakout or breakdown.
In this case, if BTC breakout this triangle pattern then we can expect a 25% bounce or the same as break down.
So let’s wait for a sustain break down or breakout will confirm the next the move of BTC .
Let's see how the market will react in few hours.
Stay tuned
This chart is likely to help you make better trade decisions if it does consider upvoting it.
I would also love to know your charts and views in the comment section.
Thank you
ノート
#BTC/USDT UPDATE
BTC is still holding the lower trend line of this triangle.
So, we are expecting some bounce up to the upper resistance in case any 4 hours candle closes below the lower trend line which will invalid the chart.
Let's see how the market will react in a few hours.
Stay tuned and pin our channel at the top.

Register on weex and trade with me: 👇
weex.com/en/register?vipCode=cryptomojo
Get CRYPTOMOJO premium for free 👉 t.me/CRYPTOMOJO_TA
weex.com/en/register?vipCode=cryptomojo
Get CRYPTOMOJO premium for free 👉 t.me/CRYPTOMOJO_TA
関連の投稿
免責事項
これらの情報および投稿は、TradingViewが提供または承認する金融、投資、取引、またはその他の種類の助言もしくは推奨であることを意図したものではなく、またこれらに該当するものでもありません。詳細は利用規約をご覧ください。
Register on weex and trade with me: 👇
weex.com/en/register?vipCode=cryptomojo
Get CRYPTOMOJO premium for free 👉 t.me/CRYPTOMOJO_TA
weex.com/en/register?vipCode=cryptomojo
Get CRYPTOMOJO premium for free 👉 t.me/CRYPTOMOJO_TA
関連の投稿
免責事項
これらの情報および投稿は、TradingViewが提供または承認する金融、投資、取引、またはその他の種類の助言もしくは推奨であることを意図したものではなく、またこれらに該当するものでもありません。詳細は利用規約をご覧ください。