Hello, everyone!
Today I noticed the insane chart pattern on the
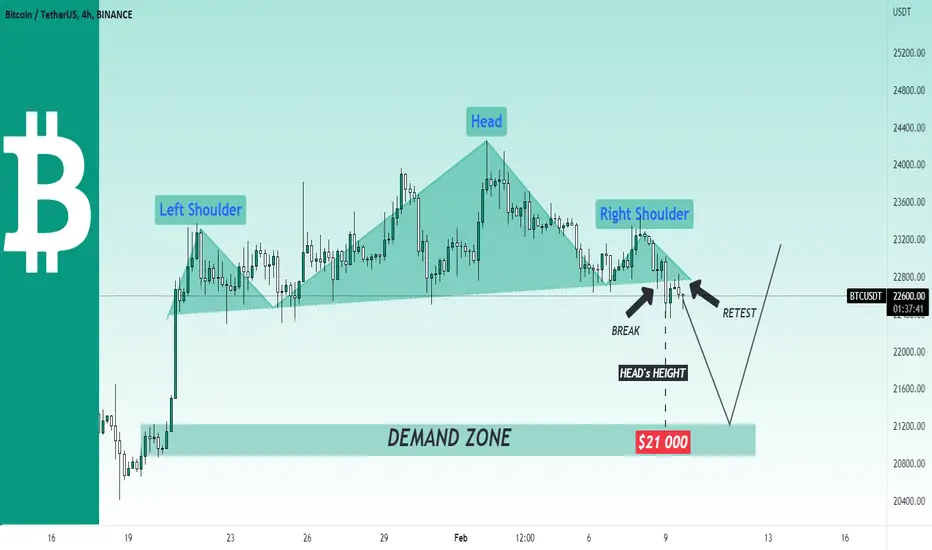
 BTCUSDT price chart. Bitcoin is showing the weakness last week and now it completed the head & shoulders chart pattern. Notice that it's neckline has been already broken and BTC has successfully retested it.
We saw the reaction on this neckline, therefore I expect the dump to the nearest demand zone at $21k. There I am going to buy Bitcoin with the further potential increase to $28k.
Best regards, Ivan
Today I noticed the insane chart pattern on the
BTCUSDT price chart. Bitcoin is showing the weakness last week and now it completed the head & shoulders chart pattern. Notice that it's neckline has been already broken and BTC has successfully retested it. We saw the reaction on this neckline, therefore I expect the dump to the nearest demand zone at $21k. There I am going to buy Bitcoin with the further potential increase to $28k.
Best regards, Ivan

Turn TradingView indicator & strategy alerts into automated trades on major crypto exchanges using no-code bots
Start free at skyrexio.com
Start free at skyrexio.com
関連の投稿
免責事項
これらの情報および投稿は、TradingViewが提供または承認する金融、投資、取引、またはその他の種類の助言もしくは推奨であることを意図したものではなく、またこれらに該当するものでもありません。詳細は利用規約をご覧ください。
Turn TradingView indicator & strategy alerts into automated trades on major crypto exchanges using no-code bots
Start free at skyrexio.com
Start free at skyrexio.com
関連の投稿
免責事項
これらの情報および投稿は、TradingViewが提供または承認する金融、投資、取引、またはその他の種類の助言もしくは推奨であることを意図したものではなく、またこれらに該当するものでもありません。詳細は利用規約をご覧ください。