
BTC/USD
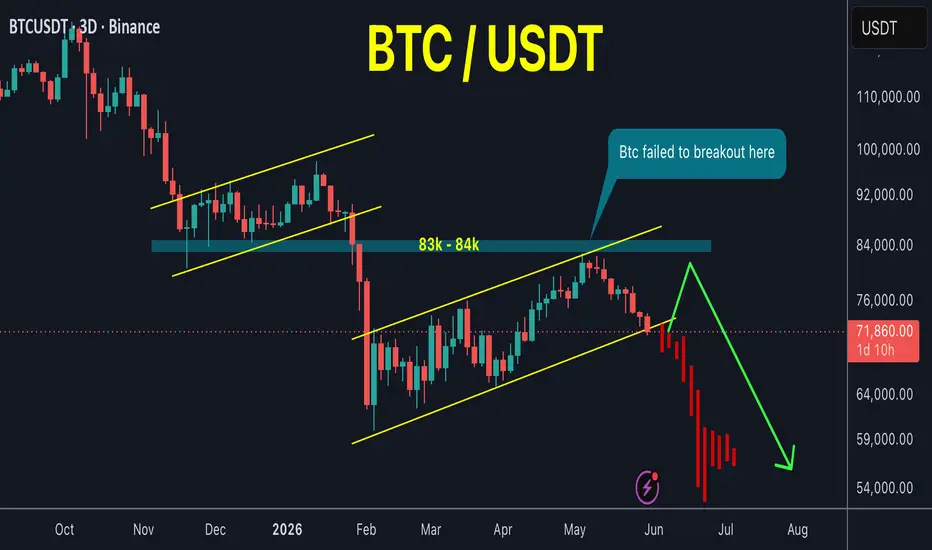
Bitcoin's price has formed another bearish flag pattern similar to the previous one.
Bitcoin has been trading within this bearish pattern for four months, and a break below it would likely lead to a price drop to a previous low or lower.
Since the top in October , the price appears to have failed to make any bullish break out, suggesting that Bitcoin will continue to decline more sooner or later until there is real trend shift in market structure
Scenario 1 and 2 both bearish now in my chart
Bitcoin's price has formed another bearish flag pattern similar to the previous one.
Bitcoin has been trading within this bearish pattern for four months, and a break below it would likely lead to a price drop to a previous low or lower.
Since the top in October , the price appears to have failed to make any bullish break out, suggesting that Bitcoin will continue to decline more sooner or later until there is real trend shift in market structure
Scenario 1 and 2 both bearish now in my chart
トレード稼働中
BTC just hit 68k ☑️トレード終了: 利益確定目標に到達
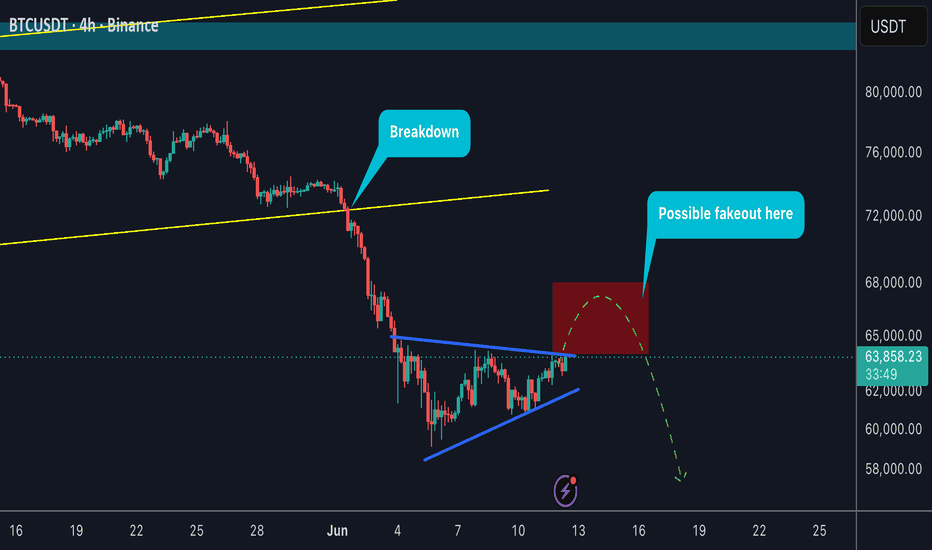
The price dropped sharply a few hours after my analysis. ノート
Update :ノート
Bitcoin reached $60,000 for the first time after four months of accumulation within this bearish pattern, as I predicted in my analysis.ノート
New update released For full details Check here : 👇

🔷 Telegram channel: t.me/bitcoin_masters
💸☎️ For Premium Signals Group ask me here: t.me/Babenski
💸☎️ For Premium Signals Group ask me here: t.me/Babenski
関連の投稿
免責事項
これらの情報および投稿は、TradingViewが提供または承認する金融、投資、取引、またはその他の種類の助言もしくは推奨であることを意図したものではなく、またこれらに該当するものでもありません。詳細は利用規約をご覧ください。
🔷 Telegram channel: t.me/bitcoin_masters
💸☎️ For Premium Signals Group ask me here: t.me/Babenski
💸☎️ For Premium Signals Group ask me here: t.me/Babenski
関連の投稿
免責事項
これらの情報および投稿は、TradingViewが提供または承認する金融、投資、取引、またはその他の種類の助言もしくは推奨であることを意図したものではなく、またこれらに該当するものでもありません。詳細は利用規約をご覧ください。