
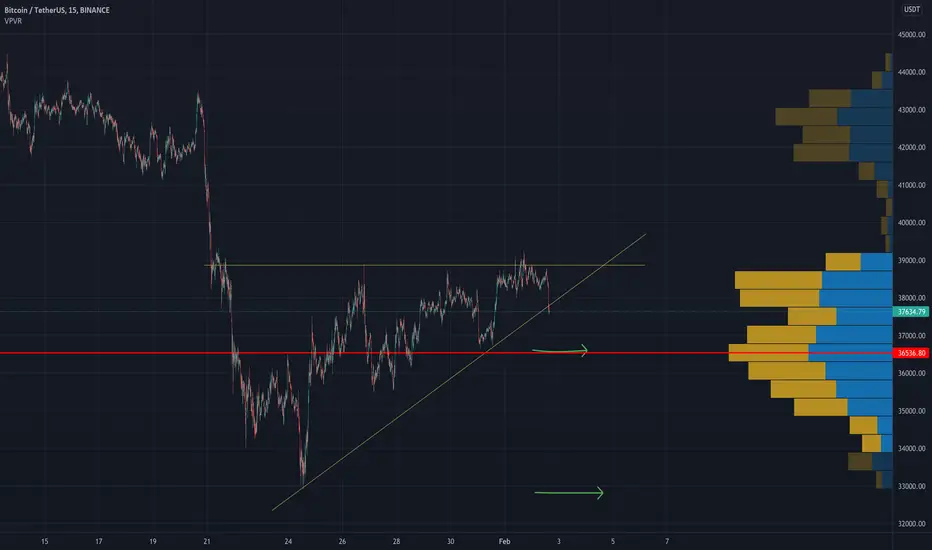
In the 15min chart we can see this ascending triangle.
The lower support is getting broken if we retest and fail to reenter the triangle we could go back down.
Targets:
- 36.5K based on volume profile, this area has big accumulation of volume to potentially hold
- 32K to 33K we could retest this level too, CPR monthly support is also around that level
Fakeout possible?
Yes, potentially we could fakeout and still claim above the triangle but that has les probability than the bearish targets
One of the main reasons that could be driving the price down now is the NASDAQ opening a red candle today (even though SPX is still green). PYPL is selling out -25% is one of them...
ノート
target 1 already met!
Join our membership to gain access to the private scripts.
patreon.com/c/thetradingparrot
patreon.com/c/thetradingparrot
関連の投稿
免責事項
これらの情報および投稿は、TradingViewが提供または承認する金融、投資、取引、またはその他の種類の助言もしくは推奨であることを意図したものではなく、またこれらに該当するものでもありません。詳細は利用規約をご覧ください。
Join our membership to gain access to the private scripts.
patreon.com/c/thetradingparrot
patreon.com/c/thetradingparrot
関連の投稿
免責事項
これらの情報および投稿は、TradingViewが提供または承認する金融、投資、取引、またはその他の種類の助言もしくは推奨であることを意図したものではなく、またこれらに該当するものでもありません。詳細は利用規約をご覧ください。