
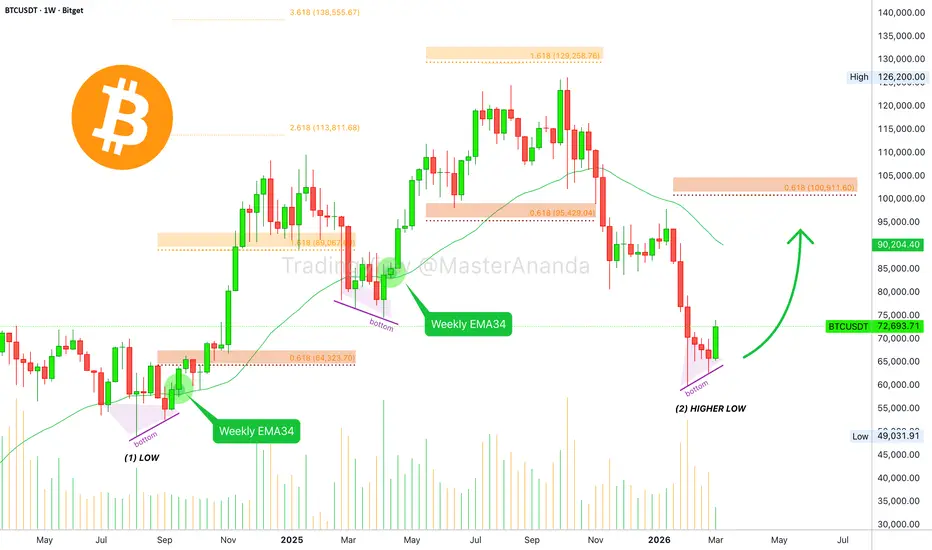
The candles were really small on the daily timeframe chart and I would like to apologize for that. I looked at the weekly to see if I can fit more data, to make the chart more appealing to your eyes. I am trying to see what will the same indicator show here, EMA34. But a few interesting things immediately showed up.
Join me in reading this chart, it will only take a few minutes of your time. I promise you will be entertained.
Interestingly enough, three weeks of bearish action have been erased in a single day. And the session that produced the major low, the 2-February week, has been pierced halfway through. This is astonishingly bullish is true.
Ok, forget about that. Here, Bitcoin is trading below EMA34. The last two major advances were confirmed with a move above this indicator. So what now?
The indicator moving down, curving down, EMA34, can work as a magnet for Bitcoin. It pulls prices up, as it is coming from above.
The reading of this exponential moving average is $90,190. This becomes a strong resistance zone. A bit lower compared to $100,000.
What happens? When there is a resistance level, or even a support, the market tends to pierce it. If the market is weak, it fails to reach the level. If the move in question is a full move, rather than peak below, it tends to pierce through resistance before any kind of reversal shows up. Makes sense?
Please, understand... All I am saying is that Bitcoin will continue to grow.
Thank you for reading.
Namaste.
Join me in reading this chart, it will only take a few minutes of your time. I promise you will be entertained.
Interestingly enough, three weeks of bearish action have been erased in a single day. And the session that produced the major low, the 2-February week, has been pierced halfway through. This is astonishingly bullish is true.
Ok, forget about that. Here, Bitcoin is trading below EMA34. The last two major advances were confirmed with a move above this indicator. So what now?
The indicator moving down, curving down, EMA34, can work as a magnet for Bitcoin. It pulls prices up, as it is coming from above.
The reading of this exponential moving average is $90,190. This becomes a strong resistance zone. A bit lower compared to $100,000.
What happens? When there is a resistance level, or even a support, the market tends to pierce it. If the market is weak, it fails to reach the level. If the move in question is a full move, rather than peak below, it tends to pierce through resistance before any kind of reversal shows up. Makes sense?
Please, understand... All I am saying is that Bitcoin will continue to grow.
Thank you for reading.
Namaste.

🔥 Get the FULL (4-in-1) PREMIUM PACKAGE 👇
t.me/lamatrades/4 (Since 2017)
✅ FREE PREMIUM trade-numbers (4-10X) 👇
t.me/masteranandatrades/9043
🚨 TOP Results May 2026 👇
t.me/masteranandatrades/8778
t.me/lamatrades/4 (Since 2017)
✅ FREE PREMIUM trade-numbers (4-10X) 👇
t.me/masteranandatrades/9043
🚨 TOP Results May 2026 👇
t.me/masteranandatrades/8778
関連の投稿
免責事項
これらの情報および投稿は、TradingViewが提供または承認する金融、投資、取引、またはその他の種類の助言もしくは推奨であることを意図したものではなく、またこれらに該当するものでもありません。詳細は利用規約をご覧ください。
🔥 Get the FULL (4-in-1) PREMIUM PACKAGE 👇
t.me/lamatrades/4 (Since 2017)
✅ FREE PREMIUM trade-numbers (4-10X) 👇
t.me/masteranandatrades/9043
🚨 TOP Results May 2026 👇
t.me/masteranandatrades/8778
t.me/lamatrades/4 (Since 2017)
✅ FREE PREMIUM trade-numbers (4-10X) 👇
t.me/masteranandatrades/9043
🚨 TOP Results May 2026 👇
t.me/masteranandatrades/8778
関連の投稿
免責事項
これらの情報および投稿は、TradingViewが提供または承認する金融、投資、取引、またはその他の種類の助言もしくは推奨であることを意図したものではなく、またこれらに該当するものでもありません。詳細は利用規約をご覧ください。