
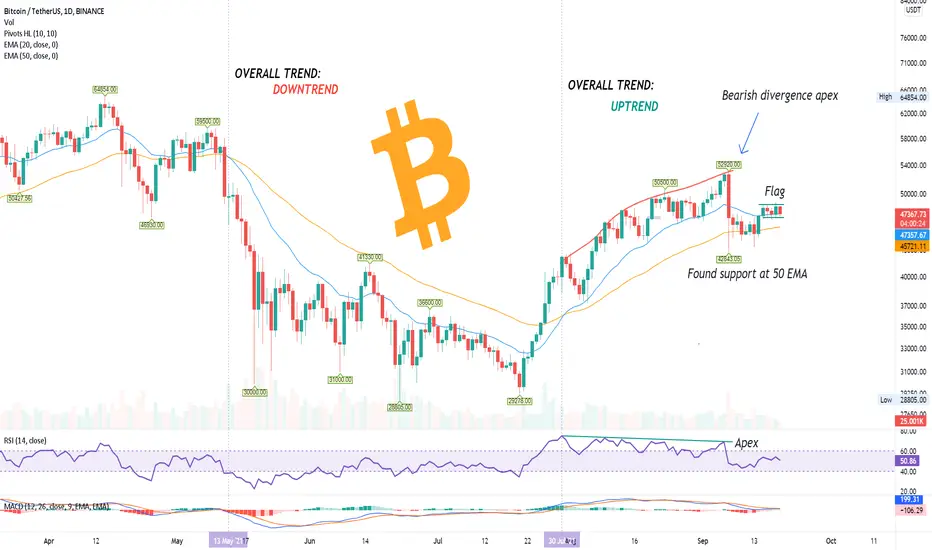
The price of Bitcoin is currently located in a pattern flag, which suggests that a certain momentum is being accumulated and we may see a strong move to the upside or downside.
Considering that this formation has been created from a leg up in uptrend, the bias should be a break to the upside.
A clear break of $49000 will be a confirmation, that we will continue to see extended gains.
However a break of $46700 will lead to extended losses to daily 50 EMA at $45500 with dips even lower.
A break to the downside would be a pretty bearish sign as Bitcoin doesn't currently have that much room to breath in order to remain bullish as the EMA's are coming close together.
Considering that this formation has been created from a leg up in uptrend, the bias should be a break to the upside.
A clear break of $49000 will be a confirmation, that we will continue to see extended gains.
However a break of $46700 will lead to extended losses to daily 50 EMA at $45500 with dips even lower.
A break to the downside would be a pretty bearish sign as Bitcoin doesn't currently have that much room to breath in order to remain bullish as the EMA's are coming close together.

関連の投稿
免責事項
これらの情報および投稿は、TradingViewが提供または承認する金融、投資、取引、またはその他の種類の助言もしくは推奨であることを意図したものではなく、またこれらに該当するものでもありません。詳細は利用規約をご覧ください。
関連の投稿
免責事項
これらの情報および投稿は、TradingViewが提供または承認する金融、投資、取引、またはその他の種類の助言もしくは推奨であることを意図したものではなく、またこれらに該当するものでもありません。詳細は利用規約をご覧ください。