
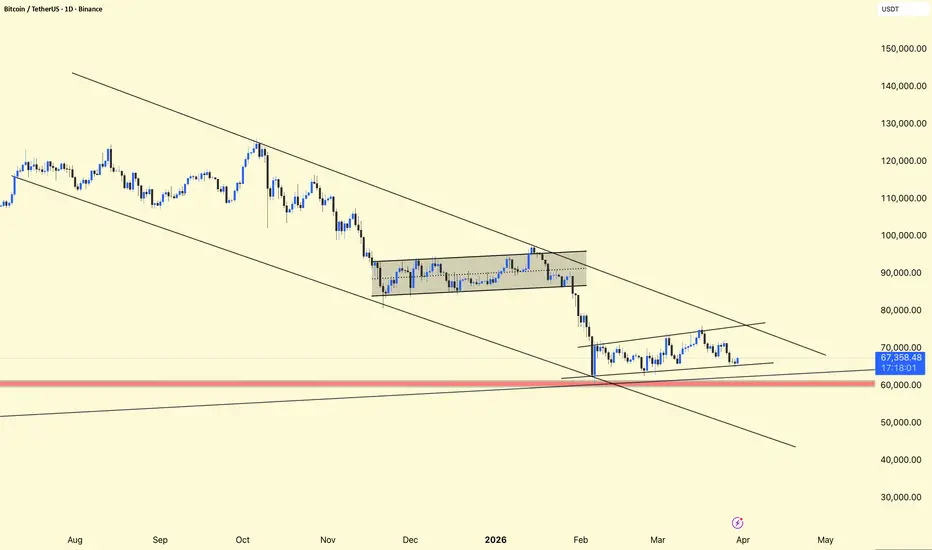
BTCUSDT – Daily Chart Update
Current Structure Price: ~$67.3K
Trading just above major support (~$60K–$62K zone)
Still inside a larger descending channel
Short-term forming a tight consolidation range
Market is compressing after a sharp drop — decision phase
Breakdown from previous range → strong sell-off
Now forming a bear flag / weak recovery structure
Lower highs still intact → trend remains bearish
Bearish Continuation (more likely currently)
Rejection from the $70K area
Break below $60K
Targets:
$55K
Possibly lower if momentum builds
Bullish Reversal (needs confirmation)
Break & hold above $72K
Invalidate the lower high structure
Then move toward:
$78K → $80K
👉 Still bearish until $72K is reclaimed

関連の投稿
免責事項
これらの情報および投稿は、TradingViewが提供または承認する金融、投資、取引、またはその他の種類の助言もしくは推奨であることを意図したものではなく、またこれらに該当するものでもありません。詳細は利用規約をご覧ください。
関連の投稿
免責事項
これらの情報および投稿は、TradingViewが提供または承認する金融、投資、取引、またはその他の種類の助言もしくは推奨であることを意図したものではなく、またこれらに該当するものでもありません。詳細は利用規約をご覧ください。