
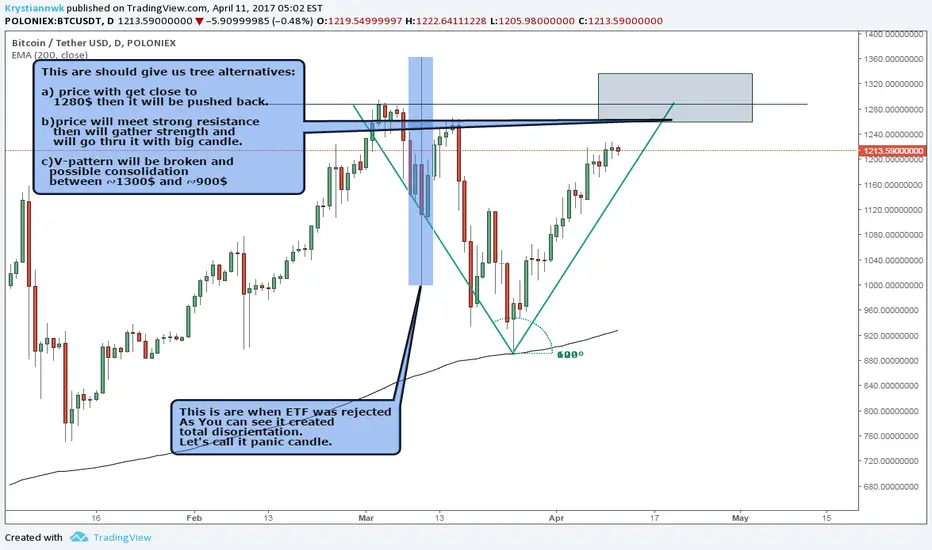
It is hard for me to predict where BTC could go in next weeks or months. I tried to apply known to me technicals but recent movements don’t fit to any of them. I found just one which could be used for “predictions” and it is called V-Pattern. I placed it on the chart(two rays deviated 60 degrees) . This pattern gives us place where we could see some interesting price action. It is marked with blue rectangle.
Fact that 200 Ema pushed price higher with ease above 1000$ mark makes me think that the bullish mode for BTC is still in play.
It is just a thought and it shouldn't be treated as trading advise
Fact that 200 Ema pushed price higher with ease above 1000$ mark makes me think that the bullish mode for BTC is still in play.
It is just a thought and it shouldn't be treated as trading advise

免責事項
これらの情報および投稿は、TradingViewが提供または承認する金融、投資、取引、またはその他の種類の助言もしくは推奨であることを意図したものではなく、またこれらに該当するものでもありません。詳細は利用規約をご覧ください。
免責事項
これらの情報および投稿は、TradingViewが提供または承認する金融、投資、取引、またはその他の種類の助言もしくは推奨であることを意図したものではなく、またこれらに該当するものでもありません。詳細は利用規約をご覧ください。