
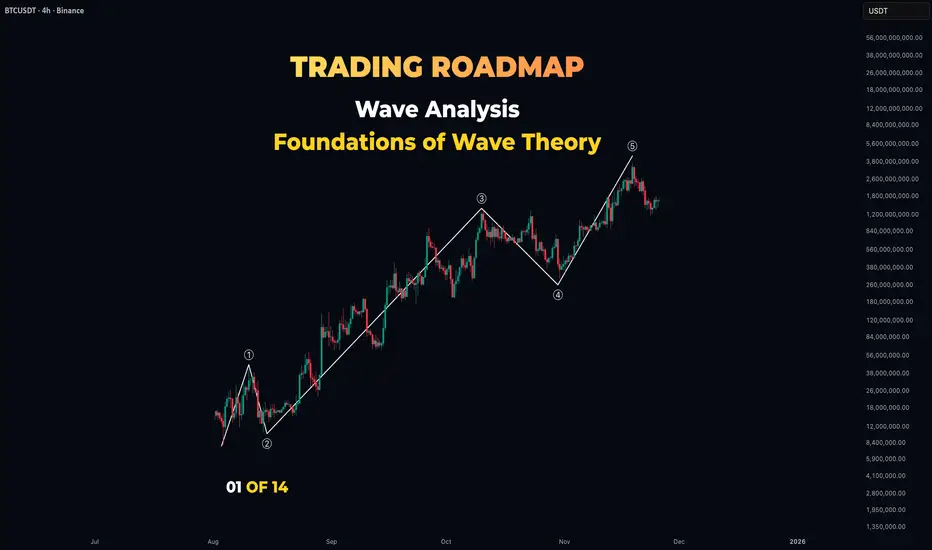
Lesson 1 - Wave Analysis Foundations: The Rhythm Behind Every Market
Difficulty: (Beginner–Intermediate)
Markets do not move randomly. They move in patterns, cycles, and rhythms that repeat across every timeframe and every asset. Wave Analysis is the framework that reads that rhythm — and once you see it, price action starts making sense in a way it never did before. Welcome to Course 02.

🔵 RECAP — WHAT YOU LEARNED IN COURSE 01
Across 12 lessons in Classical Technical Analysis, you learned how to read the chart, identify trends, draw support and resistance, recognize candle and chart patterns, interpret volume, and use Moving Averages.
Course 02 takes all of that and adds a new dimension: structure. Wave Analysis teaches you to see the underlying architecture of every price move — the pattern beneath the noise.
🔵 WHY WAVE ANALYSIS MATTERS
Most traders react to what price just did. Wave Analysis helps you understand where price is in the bigger structure — and that context can dramatically change how you trade.
With wave analysis you can:
🐳 Pro Tip: Wave Analysis is not about predicting the future with certainty. It is about mapping the possibilities and preparing for the most likely ones.
🔵 1. THE CORE IDEA — TWO TYPES OF MOVES
The market moves in two directions:
Every trend, on every timeframe, is built from these two types of moves alternating.

🐳 Pro Tip: Learn to identify whether the current move is impulsive or corrective before doing anything else. That single distinction shapes every decision.
🔵 2. THE 5-WAVE / 3-WAVE CYCLE
Classical wave theory describes a complete market cycle as 8 waves total:
In an uptrend:
The reverse structure applies in a downtrend.
🐳 Pro Tip: The 5-wave move is the trend. The 3-wave move is the correction. Learn to see them separately and everything else in wave analysis becomes easier.
🔵 3. FRACTAL NATURE — WAVES WITHIN WAVES
This is what makes wave analysis powerful and challenging at the same time.
Every wave is itself made of smaller waves. And every group of waves is part of a larger wave on a higher timeframe.

Example: Wave 3 on the daily chart may itself be made of a full 5-wave impulse when you look at the 1H chart. And that daily 5-wave sequence may be Wave 3 of a weekly move.
🐳 Pro Tip: The fractal nature means you must always know which degree (timeframe scale) you are counting. Losing track of degree is the number one cause of wrong counts.
🔵 4. THE OVERLAP TEST — HOW TO TELL THEM APART
Learning to tell an impulsive move from a corrective one is the foundation of every wave count.

Impulsive moves typically:
Corrective moves typically:
🐳 Pro Tip: Overlap is your biggest clue. Clean impulses rarely overlap. Corrections overlap constantly.
🔵 5. WAVE DEGREES — THE HIERARCHY
Waves come in different sizes, called degrees. From smallest to largest:
You do not need to memorize every degree name. What matters is knowing that a Wave 3 on one scale might be a Wave A on the next scale up.
🐳 Pro Tip: Always label the timeframe you are counting on. Never mix degrees in the same analysis.
🔵 6. HOW WAVE ANALYSIS FITS WITH EVERYTHING ELSE
Wave Analysis is not a replacement for classical TA — it is a lens you overlay on top of it.
Ways to combine:
🔵 7. COMMON BEGINNER MISTAKES
🔵 8. YOUR WAVE ANALYSIS FRAMEWORK
Before labeling any wave count, ask:
🔵 QUICK SELF-CHECK
🔵 WHAT IS NEXT
Lesson 2 — Impulse Waves (5-Wave Structure): we zoom into the impulse side of the cycle. What makes each of the 5 waves unique, how to identify them in real time, and how the rules of the 5-wave structure filter out invalid counts early.
Drop a comment: what confuses you most about wave analysis so far — degrees, corrections, or spotting impulses?
Full Trading Roadmap | Wave Analysis Course
This is the first lesson of Course 02. New lessons will be added here as they are published.
Best Regards, BigBeluga 🐳
Difficulty: (Beginner–Intermediate)
Markets do not move randomly. They move in patterns, cycles, and rhythms that repeat across every timeframe and every asset. Wave Analysis is the framework that reads that rhythm — and once you see it, price action starts making sense in a way it never did before. Welcome to Course 02.
🔵 RECAP — WHAT YOU LEARNED IN COURSE 01
Across 12 lessons in Classical Technical Analysis, you learned how to read the chart, identify trends, draw support and resistance, recognize candle and chart patterns, interpret volume, and use Moving Averages.
Course 02 takes all of that and adds a new dimension: structure. Wave Analysis teaches you to see the underlying architecture of every price move — the pattern beneath the noise.
🔵 WHY WAVE ANALYSIS MATTERS
Most traders react to what price just did. Wave Analysis helps you understand where price is in the bigger structure — and that context can dramatically change how you trade.
With wave analysis you can:
- Identify whether the current move is likely a continuation or a correction
- Estimate where a trend might slow down, reverse, or extend
- Combine price action, S/R, and momentum with clearer structural context
- Avoid entering trades right before a natural corrective phase
🐳 Pro Tip: Wave Analysis is not about predicting the future with certainty. It is about mapping the possibilities and preparing for the most likely ones.
🔵 1. THE CORE IDEA — TWO TYPES OF MOVES
The market moves in two directions:
- With the trend — impulsive moves in the dominant direction
- Against the trend — corrective moves that pause or partially reverse
Every trend, on every timeframe, is built from these two types of moves alternating.
🐳 Pro Tip: Learn to identify whether the current move is impulsive or corrective before doing anything else. That single distinction shapes every decision.
🔵 2. THE 5-WAVE / 3-WAVE CYCLE
Classical wave theory describes a complete market cycle as 8 waves total:
- 5 waves in the direction of the larger trend — labeled 1, 2, 3, 4, 5
- 3 waves against it as a correction — labeled A, B, C
In an uptrend:
- Waves 1, 3, 5 push higher (impulsive)
- Waves 2, 4 pull back inside the trend (corrective)
- Waves A, B, C form the correction after the 5-wave move completes
The reverse structure applies in a downtrend.
🐳 Pro Tip: The 5-wave move is the trend. The 3-wave move is the correction. Learn to see them separately and everything else in wave analysis becomes easier.
🔵 3. FRACTAL NATURE — WAVES WITHIN WAVES
This is what makes wave analysis powerful and challenging at the same time.
Every wave is itself made of smaller waves. And every group of waves is part of a larger wave on a higher timeframe.
Example: Wave 3 on the daily chart may itself be made of a full 5-wave impulse when you look at the 1H chart. And that daily 5-wave sequence may be Wave 3 of a weekly move.
🐳 Pro Tip: The fractal nature means you must always know which degree (timeframe scale) you are counting. Losing track of degree is the number one cause of wrong counts.
🔵 4. THE OVERLAP TEST — HOW TO TELL THEM APART
Learning to tell an impulsive move from a corrective one is the foundation of every wave count.
Impulsive moves typically:
- Travel in the direction of the higher-timeframe trend
- Are strong, decisive, with clear expansion
- Show 5 sub-waves internally with no overlap (Wave 4 low above Wave 1 high in an uptrend)
Corrective moves typically:
- Travel against the higher-timeframe trend
- Move slower, in overlapping / choppy structure
- Show 3 sub-waves internally with clear overlap between waves
🐳 Pro Tip: Overlap is your biggest clue. Clean impulses rarely overlap. Corrections overlap constantly.
🔵 5. WAVE DEGREES — THE HIERARCHY
Waves come in different sizes, called degrees. From smallest to largest:
- Sub-minuette / Minuette — intraday scale
- Minute / Minor — swing scale
- Intermediate / Primary — position scale
- Cycle / Supercycle — long-term scale
You do not need to memorize every degree name. What matters is knowing that a Wave 3 on one scale might be a Wave A on the next scale up.
🐳 Pro Tip: Always label the timeframe you are counting on. Never mix degrees in the same analysis.
🔵 6. HOW WAVE ANALYSIS FITS WITH EVERYTHING ELSE
Wave Analysis is not a replacement for classical TA — it is a lens you overlay on top of it.
Ways to combine:
- Use S/R levels to anticipate where waves might end
- Use volume to confirm whether a wave is impulsive or fading
- Use Fibonacci to measure the depth of Wave 2 and Wave 4 retracements
- Use Moving Averages as dynamic context for impulse strength
🔵 7. COMMON BEGINNER MISTAKES
- Counting waves without identifying the higher-timeframe trend first
- Forcing a 5-wave count on a corrective structure
- Mixing multiple degrees in the same analysis
- Ignoring overlap — a strong impulse should not overlap
- Treating wave counts as fixed predictions rather than working scenarios
- Skipping the fundamentals — trend, S/R, structure — and jumping straight into wave labels
🔵 8. YOUR WAVE ANALYSIS FRAMEWORK
Before labeling any wave count, ask:
- What is the higher-timeframe trend?
- Is the current move impulsive or corrective?
- Does the internal structure show 5 sub-waves or 3?
- On which degree am I counting?
🔵 QUICK SELF-CHECK
- Explain the difference between impulsive and corrective moves
- Draw a full 5-3 wave cycle on paper
- Identify at least one impulse and one correction on any live chart
- Explain what "wave degree" means
- Recognize why counting on multiple degrees at once causes errors
🔵 WHAT IS NEXT
Lesson 2 — Impulse Waves (5-Wave Structure): we zoom into the impulse side of the cycle. What makes each of the 5 waves unique, how to identify them in real time, and how the rules of the 5-wave structure filter out invalid counts early.
Drop a comment: what confuses you most about wave analysis so far — degrees, corrections, or spotting impulses?
Full Trading Roadmap | Wave Analysis Course
This is the first lesson of Course 02. New lessons will be added here as they are published.
Best Regards, BigBeluga 🐳

🔵Gain access to our powerful tools : bigbeluga.com/tv
🔵Join our free discord for updates : discord.com/invite/FuW63RKgdc
All scripts & content provided by BigBeluga are for informational & educational purposes only.
🔵Join our free discord for updates : discord.com/invite/FuW63RKgdc
All scripts & content provided by BigBeluga are for informational & educational purposes only.
免責事項
これらの情報および投稿は、TradingViewが提供または承認する金融、投資、取引、またはその他の種類の助言もしくは推奨であることを意図したものではなく、またこれらに該当するものでもありません。詳細は利用規約をご覧ください。
🔵Gain access to our powerful tools : bigbeluga.com/tv
🔵Join our free discord for updates : discord.com/invite/FuW63RKgdc
All scripts & content provided by BigBeluga are for informational & educational purposes only.
🔵Join our free discord for updates : discord.com/invite/FuW63RKgdc
All scripts & content provided by BigBeluga are for informational & educational purposes only.
免責事項
これらの情報および投稿は、TradingViewが提供または承認する金融、投資、取引、またはその他の種類の助言もしくは推奨であることを意図したものではなく、またこれらに該当するものでもありません。詳細は利用規約をご覧ください。