
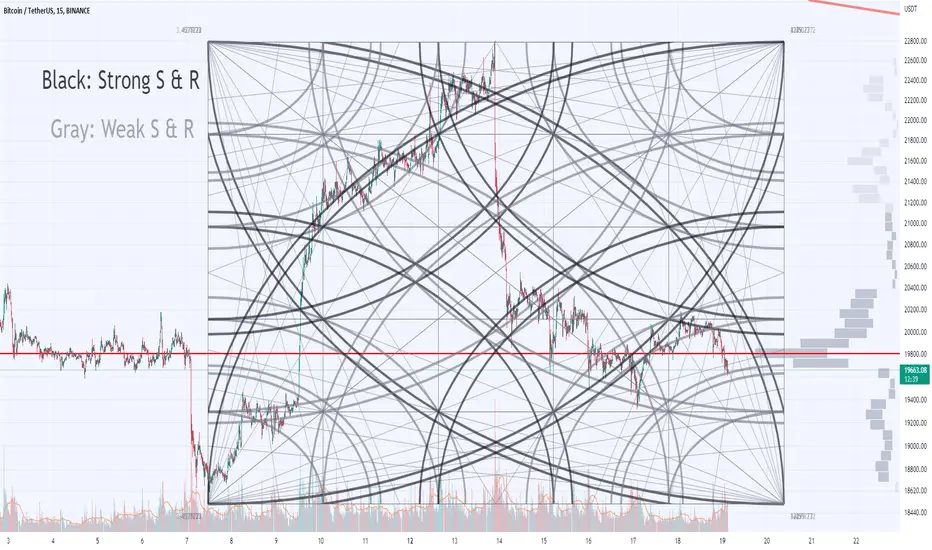
This is a short-TF analysis using Gann Square & arcs.
It seems no strong support is left for BTC in this timeframe.
Gann Square, the built-in smart tool of TradingView, is provided with many fans and arcs. Every single one of them, if properly plotted, is considered to serve as S & R. Not to mention their crosspoints.
In this chart, I applied it so that only the strong movements (progressive waves in the E.W. Theory) in the trend direction penetrate the arcs and the crosspoints.
The third and fifth arcs (black) are said to be stronger than others (gray).
ノート
Update.
ノート
Update.
*For trolls in the comment area, you might want to compare TA elements you happen to know with Gan Square you don't know, before posting useless something.
ノート
As predicted, weak supports have all been broken.
Now at FE 3. 618, a possible rebound area, but it could go further down.

関連の投稿
免責事項
これらの情報および投稿は、TradingViewが提供または承認する金融、投資、取引、またはその他の種類の助言もしくは推奨であることを意図したものではなく、またこれらに該当するものでもありません。詳細は利用規約をご覧ください。
免責事項
これらの情報および投稿は、TradingViewが提供または承認する金融、投資、取引、またはその他の種類の助言もしくは推奨であることを意図したものではなく、またこれらに該当するものでもありません。詳細は利用規約をご覧ください。