
[I]Analysis
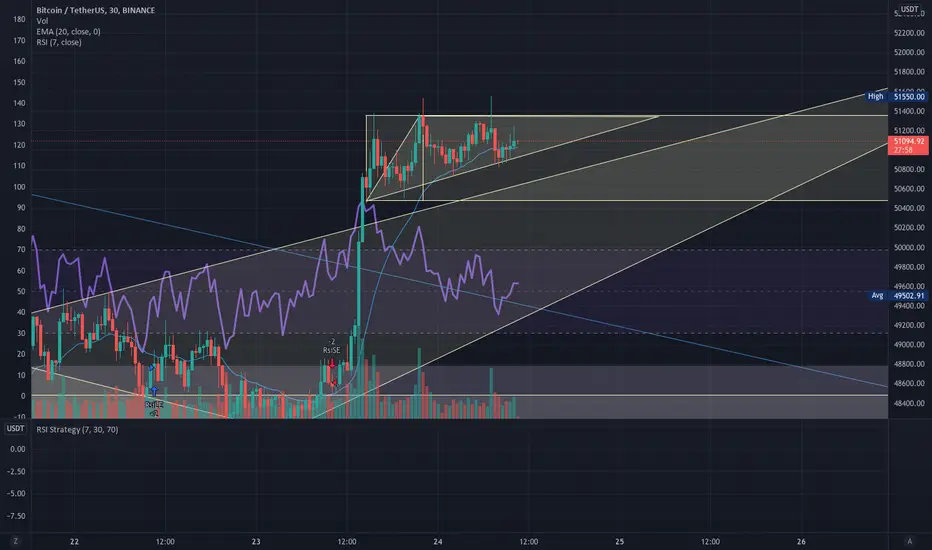
Clear Ascending Triangle in the making on the 30m Chart.
RSI mostly overbought but with yesterday's rally, RSI isn't something to completely rely on.
EMA20 just crossed on the 30m Chart, meaning that it can bounce back up from here, or make a reversal down to an abyss.
[I]Personal Thoughts[/I]
EMA20 doesn't lie, meaning that BTC has to make a decision of another $1000 bull run or dive back down.
I believe it will make a $1000 run.
RSI seems to be overbought on many charts, but Weekly Chart is still oversold for many days to come, so the pressure is still here for another $1000 bull run.
Ascending Triangle is getting thin, and BTC normally doesn't get to the thinnest point.
In the next 30 to 90 minutes we have the see that Ascending Triangle break.
Clear Ascending Triangle in the making on the 30m Chart.
RSI mostly overbought but with yesterday's rally, RSI isn't something to completely rely on.
EMA20 just crossed on the 30m Chart, meaning that it can bounce back up from here, or make a reversal down to an abyss.
[I]Personal Thoughts[/I]
EMA20 doesn't lie, meaning that BTC has to make a decision of another $1000 bull run or dive back down.
I believe it will make a $1000 run.
RSI seems to be overbought on many charts, but Weekly Chart is still oversold for many days to come, so the pressure is still here for another $1000 bull run.
Ascending Triangle is getting thin, and BTC normally doesn't get to the thinnest point.
In the next 30 to 90 minutes we have the see that Ascending Triangle break.

関連の投稿
免責事項
これらの情報および投稿は、TradingViewが提供または承認する金融、投資、取引、またはその他の種類の助言もしくは推奨であることを意図したものではなく、またこれらに該当するものでもありません。詳細は利用規約をご覧ください。
免責事項
これらの情報および投稿は、TradingViewが提供または承認する金融、投資、取引、またはその他の種類の助言もしくは推奨であることを意図したものではなく、またこれらに該当するものでもありません。詳細は利用規約をご覧ください。