Hey Realistic Traders!
“Bitcoin Is Riding Bearish Reversal Momentum, Is a New Lower Low on the Horizon?”
Let’s dive into the technical analysis to answer this question and see what the chart is really telling us.
Technical Analysis
On the daily chart,
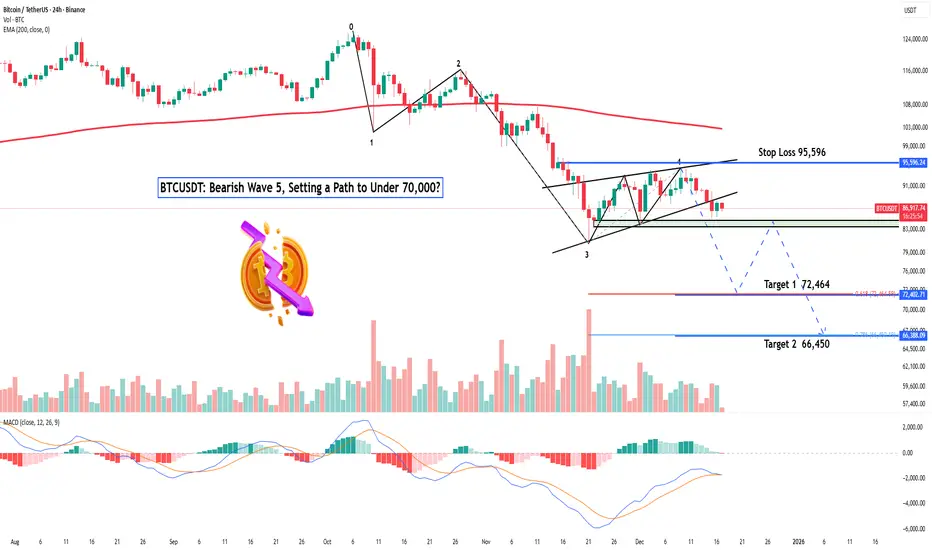
 BTCUSDT has moved below the EMA200 line. Each rebound has failed to break above, and price has rarely even touched the EMA200, reinforcing the strength of the broader bearish trend.
During the Wave 4 formation, BTCUSDT consolidated within a rising wedge pattern, a corrective structure that typically appears as upside momentum weakens within a larger downtrend. A decisive breakdown from this pattern signals renewed bearish pressure and often marks the beginning of Wave 5 in Elliott Wave theory.
Following the breakdown, a bearish MACD crossover occurred, adding confirmation to the bearish bias. Together, these signals strengthen the view that momentum is shifting back in favor of the bears.
Based on Fibonacci projections, Wave 5 may extend toward the 0.786 Fibonacci ratio, aligning with the second downside target near 66,450. Before reaching that level, price may encounter a historical support zone around the first target at 72,464, where a temporary pullback could occur.
This bearish wave count remains valid as long as price stays below the stop-loss level at 95,596. A move above this level would invalidate the potential Wave 5 formation and shift the outlook back to neutral.
Support the channel by engaging with the content, using the rocket button, and sharing your opinions in the comments below 🚀
Disclaimer:
Please note that this analysis is solely for educational purposes and should not be considered a recommendation to take a long or short position on Bitcoin.
“Bitcoin Is Riding Bearish Reversal Momentum, Is a New Lower Low on the Horizon?”
Let’s dive into the technical analysis to answer this question and see what the chart is really telling us.
Technical Analysis
On the daily chart,
BTCUSDT has moved below the EMA200 line. Each rebound has failed to break above, and price has rarely even touched the EMA200, reinforcing the strength of the broader bearish trend.During the Wave 4 formation, BTCUSDT consolidated within a rising wedge pattern, a corrective structure that typically appears as upside momentum weakens within a larger downtrend. A decisive breakdown from this pattern signals renewed bearish pressure and often marks the beginning of Wave 5 in Elliott Wave theory.
Following the breakdown, a bearish MACD crossover occurred, adding confirmation to the bearish bias. Together, these signals strengthen the view that momentum is shifting back in favor of the bears.
Based on Fibonacci projections, Wave 5 may extend toward the 0.786 Fibonacci ratio, aligning with the second downside target near 66,450. Before reaching that level, price may encounter a historical support zone around the first target at 72,464, where a temporary pullback could occur.
This bearish wave count remains valid as long as price stays below the stop-loss level at 95,596. A move above this level would invalidate the potential Wave 5 formation and shift the outlook back to neutral.
Support the channel by engaging with the content, using the rocket button, and sharing your opinions in the comments below 🚀
Disclaimer:
Please note that this analysis is solely for educational purposes and should not be considered a recommendation to take a long or short position on Bitcoin.
トレード稼働中
An Inverted Bearish Hammer formed near the lower trendline, signaling a bearish bias
関連の投稿
免責事項
これらの情報および投稿は、TradingViewが提供または承認する金融、投資、取引、またはその他の種類の助言もしくは推奨であることを意図したものではなく、またこれらに該当するものでもありません。詳細は利用規約をご覧ください。
関連の投稿
免責事項
これらの情報および投稿は、TradingViewが提供または承認する金融、投資、取引、またはその他の種類の助言もしくは推奨であることを意図したものではなく、またこれらに該当するものでもありません。詳細は利用規約をご覧ください。