
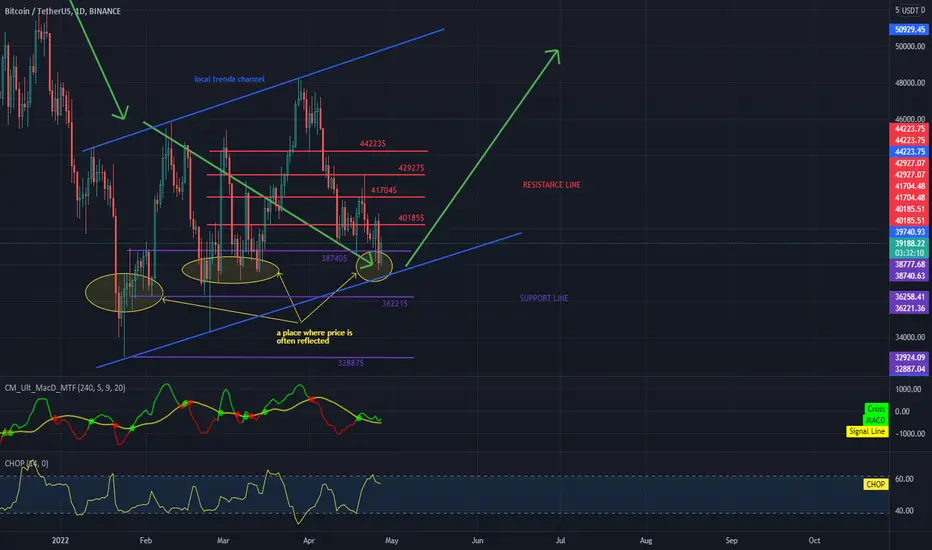
Hello everyone, let's take a look at the BTC to USDT chart on a 1 day time frame. As you can see, the price moves in the local uptrend channel marked with blue lines.
Let's start with the designation of the support line and as you can see the first support where BTC is currently at is $ 38,740, if the support breaks down, the next is $ 36,221 and $ 32,887.
Now let's move from the resistance line as you can see the first resistance is $ 40,185, if you can break it the next resistance will be $ 41,704 and $ 42,927 plus $ 44,223.
Looking at the CHOP indicator, we can see that we have a lot of energy in the 1-day interval. On the other hand, the MACD indicator shows that we are at the border, but we are maintaining an uptrend.
Let's start with the designation of the support line and as you can see the first support where BTC is currently at is $ 38,740, if the support breaks down, the next is $ 36,221 and $ 32,887.
Now let's move from the resistance line as you can see the first resistance is $ 40,185, if you can break it the next resistance will be $ 41,704 and $ 42,927 plus $ 44,223.
Looking at the CHOP indicator, we can see that we have a lot of energy in the 1-day interval. On the other hand, the MACD indicator shows that we are at the border, but we are maintaining an uptrend.

免責事項
これらの情報および投稿は、TradingViewが提供または承認する金融、投資、取引、またはその他の種類の助言もしくは推奨であることを意図したものではなく、またこれらに該当するものでもありません。詳細は利用規約をご覧ください。
免責事項
これらの情報および投稿は、TradingViewが提供または承認する金融、投資、取引、またはその他の種類の助言もしくは推奨であることを意図したものではなく、またこれらに該当するものでもありません。詳細は利用規約をご覧ください。