
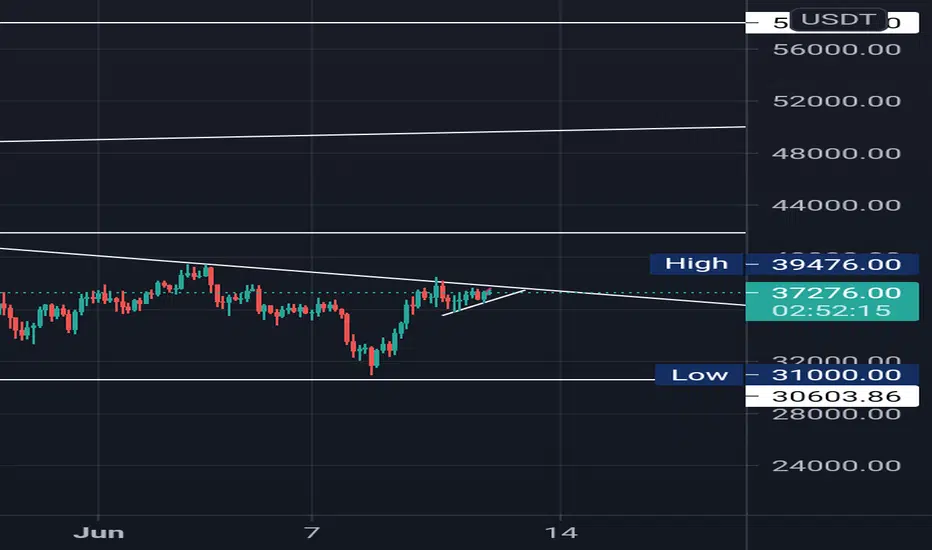
After 30,000 low
On 1D time frame we can see a descending triangle.
When we move to 4hr chart one more pattern " symmetric triangle " forming at the resistance of descending triangle (1D)
Moving at 15 min chart noticed a flag and pole condition the rsi was indicating OB.
I've entered at 37095 with sl or 36375 and target with 40,000 as round figure and 41900 (t2)
On 1D time frame we can see a descending triangle.
When we move to 4hr chart one more pattern " symmetric triangle " forming at the resistance of descending triangle (1D)
Moving at 15 min chart noticed a flag and pole condition the rsi was indicating OB.
I've entered at 37095 with sl or 36375 and target with 40,000 as round figure and 41900 (t2)

免責事項
これらの情報および投稿は、TradingViewが提供または承認する金融、投資、取引、またはその他の種類の助言もしくは推奨であることを意図したものではなく、またこれらに該当するものでもありません。詳細は利用規約をご覧ください。
免責事項
これらの情報および投稿は、TradingViewが提供または承認する金融、投資、取引、またはその他の種類の助言もしくは推奨であることを意図したものではなく、またこれらに該当するものでもありません。詳細は利用規約をご覧ください。