
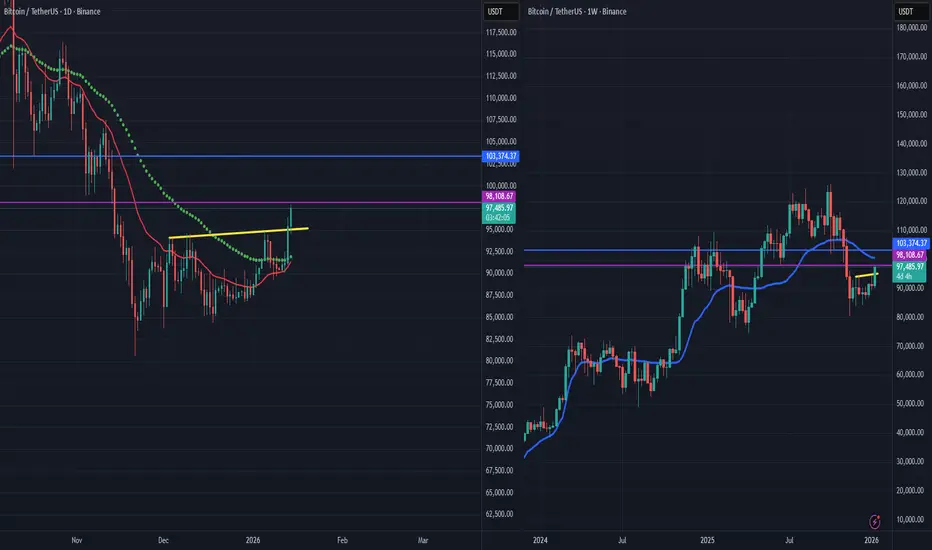
The chart shows an inverse head and shoulders pattern, but as long as we stay above the yellow line, the direction is upward. The first target of the formation is the 98,108 level, which corresponds to the 1.414 Fibonacci retracement of the breakout, with the main target being around 103,000. Pay attention to the Kaufman indicator on the weekly timeframe as an intermediate resistance level.

免責事項
これらの情報および投稿は、TradingViewが提供または承認する金融、投資、取引、またはその他の種類の助言もしくは推奨であることを意図したものではなく、またこれらに該当するものでもありません。詳細は利用規約をご覧ください。
免責事項
これらの情報および投稿は、TradingViewが提供または承認する金融、投資、取引、またはその他の種類の助言もしくは推奨であることを意図したものではなく、またこれらに該当するものでもありません。詳細は利用規約をご覧ください。