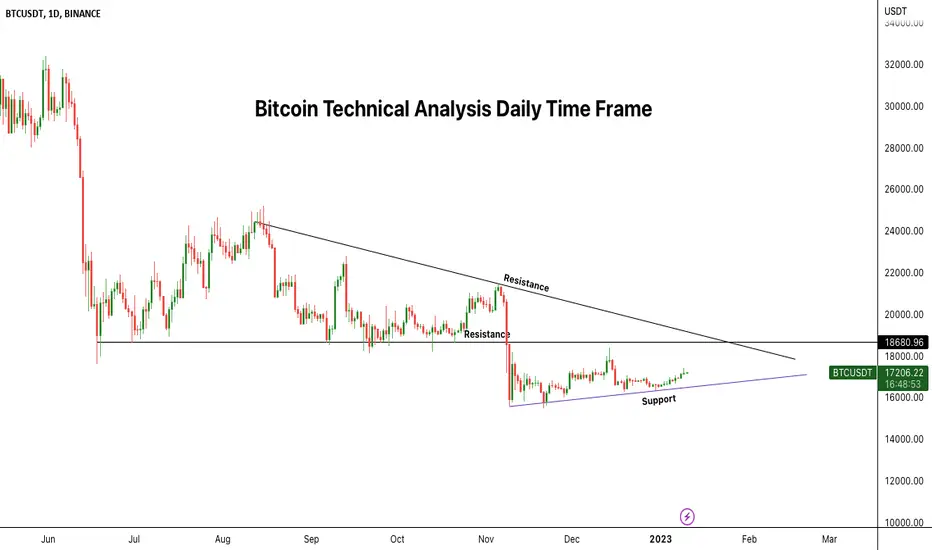
#Bitcoin Technical Analysis:-
 BTC currently trading at $17200 Level.
As per chart strong holding support $16000 Level which is good for Bull’s.
Next Resistance is $18700 which is also retest level of Last breakdown Support.
I am expecting some Rejection from that level and we can see some more Down side move.
But now we can see some upward move in short term.
My Resistance levels:- $18700-$19000
Support:- $16500
Never Trade blindly.
Always open trade after confirmations.
BTC currently trading at $17200 Level.As per chart strong holding support $16000 Level which is good for Bull’s.
Next Resistance is $18700 which is also retest level of Last breakdown Support.
I am expecting some Rejection from that level and we can see some more Down side move.
But now we can see some upward move in short term.
My Resistance levels:- $18700-$19000
Support:- $16500
Never Trade blindly.
Always open trade after confirmations.

Twitter: twitter.com/CryptoPatel
Telegram: t.me/OfficialCryptoPatel
Instagram: instagram.com/cryptopatel?utm_medium=copy_link
Telegram: t.me/OfficialCryptoPatel
Instagram: instagram.com/cryptopatel?utm_medium=copy_link
免責事項
これらの情報および投稿は、TradingViewが提供または承認する金融、投資、取引、またはその他の種類の助言もしくは推奨であることを意図したものではなく、またこれらに該当するものでもありません。詳細は利用規約をご覧ください。