
Bitcoin "Channel" Breakout Analysis
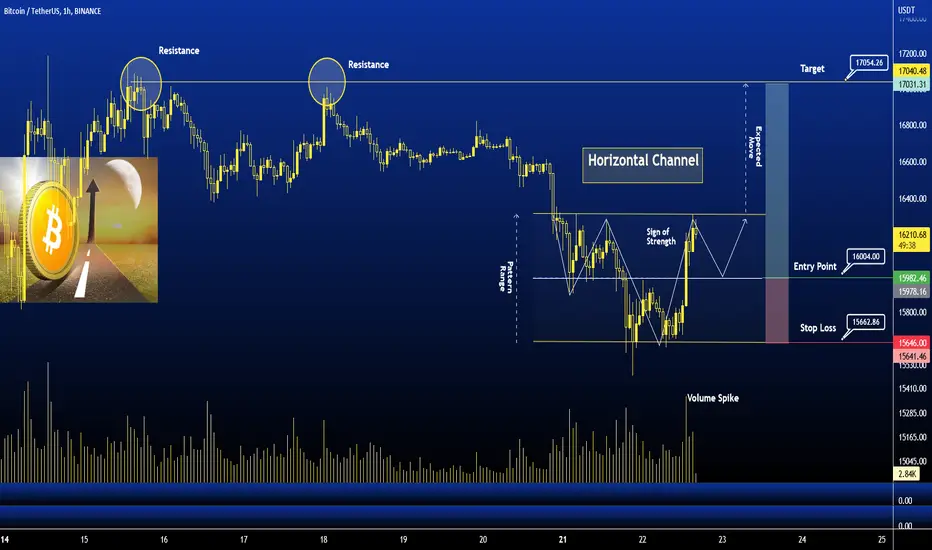
The above chart of Bitcoin laid out the Horizontal channel pattern. Horizontal channel pattern also known as the sideways trend. In general, the horizontal channel is formed during the price consolidation. In this pattern, the upper trendline, the line which connects the highs, and the lower trendline, line which connects the lows, run horizontally parallel and the price action is contained within it. A horizontal channel is often regarded as one of the suitable patterns for timing the market as the buying and selling points are in consolidation.
Currently, Bitcoin is in the range of $16189. If the pattern continues, the price of Bitcoin might reach the resistance levels of $17050 If the trend reverses, then the price of Bitcoin may fall to $15660
Key Points : Bullish Candle and Volume Spike
Happy Trading
The above chart of Bitcoin laid out the Horizontal channel pattern. Horizontal channel pattern also known as the sideways trend. In general, the horizontal channel is formed during the price consolidation. In this pattern, the upper trendline, the line which connects the highs, and the lower trendline, line which connects the lows, run horizontally parallel and the price action is contained within it. A horizontal channel is often regarded as one of the suitable patterns for timing the market as the buying and selling points are in consolidation.
Currently, Bitcoin is in the range of $16189. If the pattern continues, the price of Bitcoin might reach the resistance levels of $17050 If the trend reverses, then the price of Bitcoin may fall to $15660
Key Points : Bullish Candle and Volume Spike
Happy Trading
ノート

関連の投稿
免責事項
これらの情報および投稿は、TradingViewが提供または承認する金融、投資、取引、またはその他の種類の助言もしくは推奨であることを意図したものではなく、またこれらに該当するものでもありません。詳細は利用規約をご覧ください。
関連の投稿
免責事項
これらの情報および投稿は、TradingViewが提供または承認する金融、投資、取引、またはその他の種類の助言もしくは推奨であることを意図したものではなく、またこれらに該当するものでもありません。詳細は利用規約をご覧ください。