
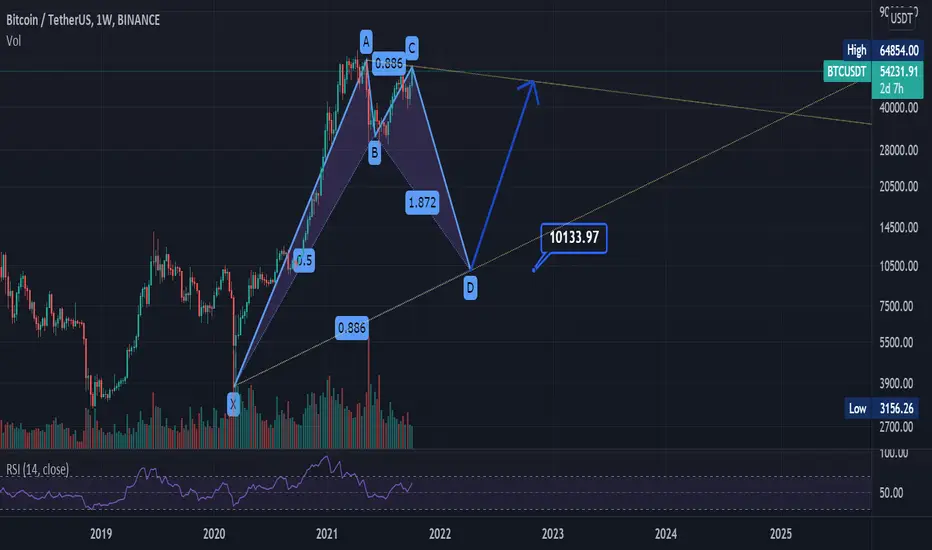
According to the wave structure of Elliot theory, BTC can form a bullish bat formation.
ノート
1-BTC is drawing a rising wedge on this chart. I chose Binance's Futures trades chart to better convey the wedge's contact areas. Because at the overbought points, there is a contact with the upper limit of the wedge. I think we are now at point D of the wedge. If we get to point E and break the wedge down, the wedge itself can go down to the 33-32k range.I think the breakout will happen because there has been a noticeable drop in volume even though BTC has been on the rise since July. This is the first disharmony you want to tell you about.
ノート
2-But the situation changes if this rising wedge is not just a wedge but also a bear flag.ノート
3-In this case, the target of the bear flag turns out to be 10.133k, which is also the target of our bullish bat formation.ノート
4- When we look at the 1-day RSI, it seems that BTC could not break the falling trend and is still watching below. Also, when we look at the chart, even though BTC has reached the level of 56,100, it is still below the top of 52,900.In addition, BTC reached the level of 55,750 on October 6, and today it has risen to the top of 56,100 by exceeding that level. Although there was an increase in price, this increase was not reflected in the RSI and created a negative dissonance.
ノート
5-According to the Stock RSI indicator, BTC was at the top of 55.750, while it was at 100, today it is in the range of 95-91. This creates a mismatch. At the same time, these regions are overbought regions.ノート
6-The process I see in this chart, which I shared on September 18, almost imitates the fall of BTC from 64k.ノート
7-We see the same graphic as I mentioned in information number 3. Of course, I shared it when I was at point D.ノート
Of course, all this analysis is canceled by a refraction towards the upper channel of the rising wedge. :)
免責事項
これらの情報および投稿は、TradingViewが提供または承認する金融、投資、取引、またはその他の種類の助言もしくは推奨であることを意図したものではなく、またこれらに該当するものでもありません。詳細は利用規約をご覧ください。
免責事項
これらの情報および投稿は、TradingViewが提供または承認する金融、投資、取引、またはその他の種類の助言もしくは推奨であることを意図したものではなく、またこれらに該当するものでもありません。詳細は利用規約をご覧ください。