
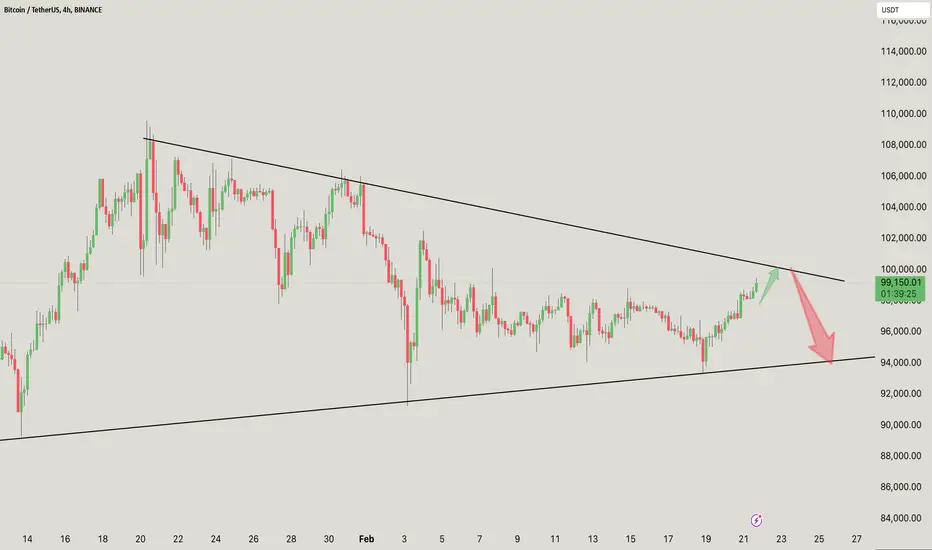
The BTC/USDT chart shows a symmetrical triangle structure, indicating a period of consolidation. The price is around 99,098.28 USDT, and it appears to be approaching the triangle's upper trendline.
The lower trendline suggests a support level near 94,000 USDT.
The upper trendline acts as resistance, around 100,000 USDT.
Possible Movement: A breakout above the resistance could lead to upward momentum, while a drop below the support could indicate a bearish trend.
Monitor the trading volume during these breakout attempts to confirm the direction!
If you found this analysis helpful, hit the Like button and share your thoughts or questions in the comments below. Your feedback matters!
Thanks for your support!
DYOR. NFA
The lower trendline suggests a support level near 94,000 USDT.
The upper trendline acts as resistance, around 100,000 USDT.
Possible Movement: A breakout above the resistance could lead to upward momentum, while a drop below the support could indicate a bearish trend.
Monitor the trading volume during these breakout attempts to confirm the direction!
If you found this analysis helpful, hit the Like button and share your thoughts or questions in the comments below. Your feedback matters!
Thanks for your support!
DYOR. NFA

関連の投稿
免責事項
これらの情報および投稿は、TradingViewが提供または承認する金融、投資、取引、またはその他の種類の助言もしくは推奨であることを意図したものではなく、またこれらに該当するものでもありません。詳細は利用規約をご覧ください。
関連の投稿
免責事項
これらの情報および投稿は、TradingViewが提供または承認する金融、投資、取引、またはその他の種類の助言もしくは推奨であることを意図したものではなく、またこれらに該当するものでもありません。詳細は利用規約をご覧ください。