
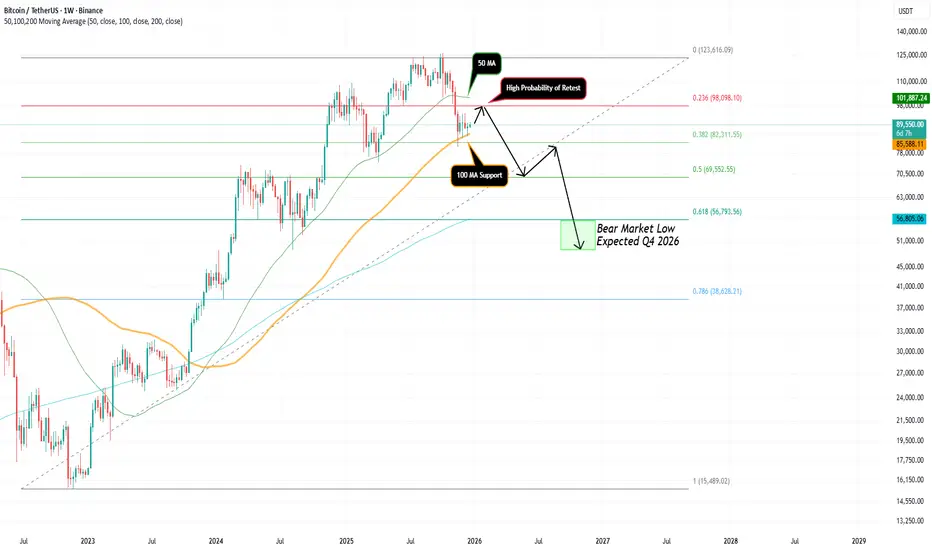
What I have laid out in this chart are the current key moving averages on the weekly timeframe (50,100,200) and the most important Fibonacci levels from our 2022 bear market low to our 2025 bull market high.
Right now BTC is holding the 100 MA very nicely which should lead to a rebound back to the upside. If this rebound is to occur we should see BTC move somewhere between $98k-$102k to create a potential lower high.
This would be in line with the 0.236 fibonnaci level (red) as well as the 50 MA (weekly) acting as a new resistance level. This weekly 50 MA acted as support a few times on the way up so now that price action is trading below it, we could see that be a key level to watch for selling pressure.
If this bounce and lower high is to be created then my black arrows represent what could be the most likely scenario! This is based on history so far repeating and if the 4Yr cycle theory does indeed lead us to our next bear market low in Q4 2026 before the next cycle begins.
Right now BTC is holding the 100 MA very nicely which should lead to a rebound back to the upside. If this rebound is to occur we should see BTC move somewhere between $98k-$102k to create a potential lower high.
This would be in line with the 0.236 fibonnaci level (red) as well as the 50 MA (weekly) acting as a new resistance level. This weekly 50 MA acted as support a few times on the way up so now that price action is trading below it, we could see that be a key level to watch for selling pressure.
If this bounce and lower high is to be created then my black arrows represent what could be the most likely scenario! This is based on history so far repeating and if the 4Yr cycle theory does indeed lead us to our next bear market low in Q4 2026 before the next cycle begins.

免責事項
これらの情報および投稿は、TradingViewが提供または承認する金融、投資、取引、またはその他の種類の助言もしくは推奨であることを意図したものではなく、またこれらに該当するものでもありません。詳細は利用規約をご覧ください。
免責事項
これらの情報および投稿は、TradingViewが提供または承認する金融、投資、取引、またはその他の種類の助言もしくは推奨であることを意図したものではなく、またこれらに該当するものでもありません。詳細は利用規約をご覧ください。