
Bitcoin "Channel Trend" Buying Climax
Hourly Time Frame Analysis
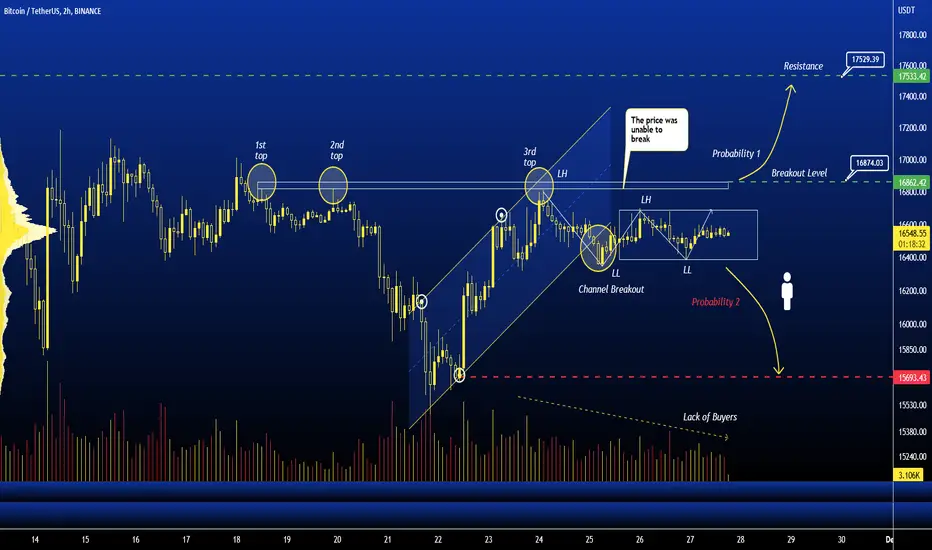
Since the 21st of November, Bitcoin has traded in the Ascending Channel Pattern range, and on the 25th of November, Bitcoin breached the Channel Trend Resistance with average volume, which should have improved exit odds and caused the price to begin consolidating in the range of 16385 $ to 16685 $.
As a result, we can anticipate two possibilities for price action based on the current movement.
Probability 1 : Price may break through the breakout level and price will rise to the resistance level of 17520 $.
Probability 2 : Once the Lower Low structure is broken, we may see a reversal trend, and then price may fall to the next support level of 15960$.
Happy Trading
Hourly Time Frame Analysis
Since the 21st of November, Bitcoin has traded in the Ascending Channel Pattern range, and on the 25th of November, Bitcoin breached the Channel Trend Resistance with average volume, which should have improved exit odds and caused the price to begin consolidating in the range of 16385 $ to 16685 $.
As a result, we can anticipate two possibilities for price action based on the current movement.
Probability 1 : Price may break through the breakout level and price will rise to the resistance level of 17520 $.
Probability 2 : Once the Lower Low structure is broken, we may see a reversal trend, and then price may fall to the next support level of 15960$.
Happy Trading

関連の投稿
免責事項
これらの情報および投稿は、TradingViewが提供または承認する金融、投資、取引、またはその他の種類の助言もしくは推奨であることを意図したものではなく、またこれらに該当するものでもありません。詳細は利用規約をご覧ください。
免責事項
これらの情報および投稿は、TradingViewが提供または承認する金融、投資、取引、またはその他の種類の助言もしくは推奨であることを意図したものではなく、またこれらに該当するものでもありません。詳細は利用規約をご覧ください。