
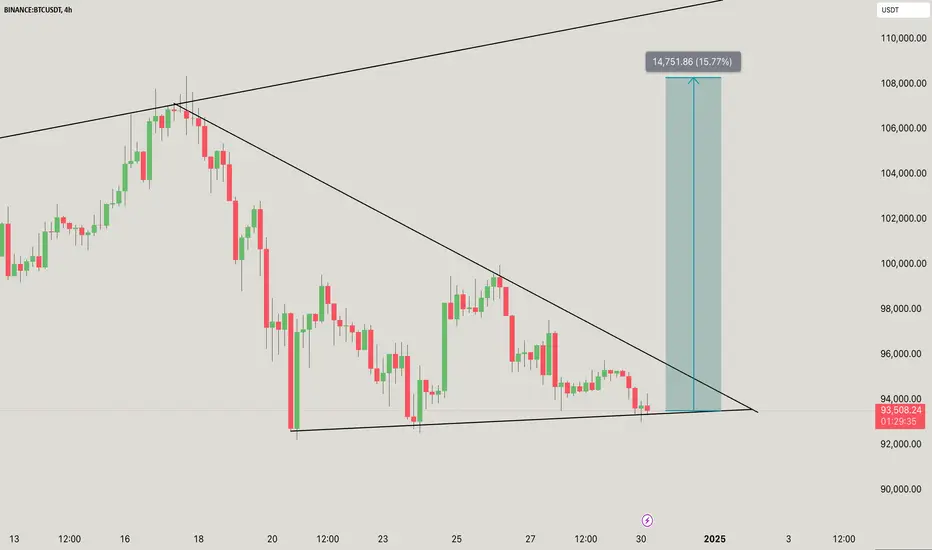
BTC/USDT consolidates within a symmetrical triangle, indicating a potential breakout.
This pattern often translates into a significant price movement, either upwards or downwards.
As highlighted in the chart, if BTC breaks out to the upside, the price projection is approximately 15.77%.
The measured move aligns with historical price action and the triangle's width.
Support Level: Near $93,000
The breakout of the triangle will determine the next directional trend.
Keep an eye on increased trading volume to confirm the validity of the breakout.
If the breakout is bullish: The potential target is $108,000
Let me know if you’d like further assistance or adjustments!
DYOR. NFA

関連の投稿
免責事項
これらの情報および投稿は、TradingViewが提供または承認する金融、投資、取引、またはその他の種類の助言もしくは推奨であることを意図したものではなく、またこれらに該当するものでもありません。詳細は利用規約をご覧ください。
関連の投稿
免責事項
これらの情報および投稿は、TradingViewが提供または承認する金融、投資、取引、またはその他の種類の助言もしくは推奨であることを意図したものではなく、またこれらに該当するものでもありません。詳細は利用規約をご覧ください。