
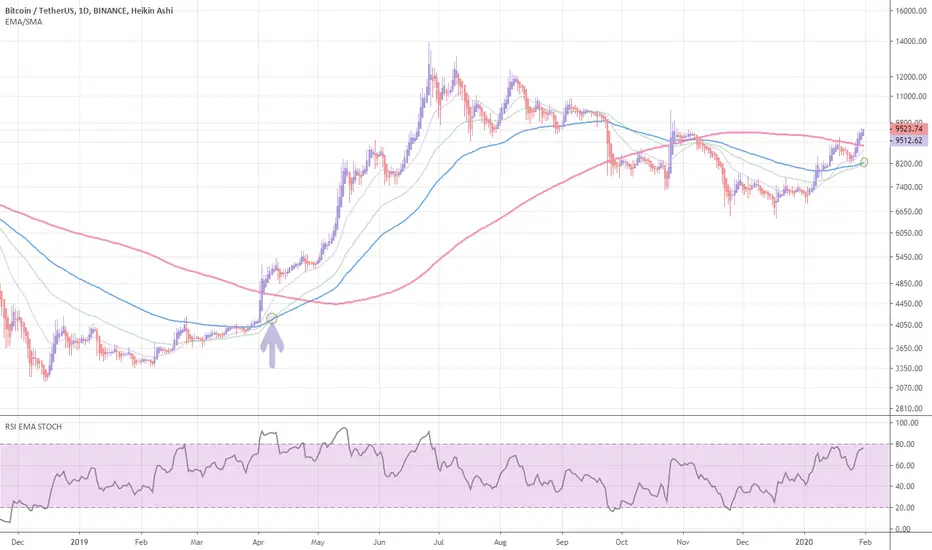
The last time the 55 and 100 EMA's crossed up was on 7 April 2019.
Recently they have crossed up again, and we'll see what kind of effect this has on the bitcoin price over the next few months - of what could be a sustained bull run.
Recently they have crossed up again, and we'll see what kind of effect this has on the bitcoin price over the next few months - of what could be a sustained bull run.
ノート
Argh I don't know why Tradingview moved the arrow upwards - it's meant to be pointing a little lower, at the cross of the green and blue EMA lines. There is also a circle showing the cross on 7 April 2019.
免責事項
これらの情報および投稿は、TradingViewが提供または承認する金融、投資、取引、またはその他の種類の助言もしくは推奨であることを意図したものではなく、またこれらに該当するものでもありません。詳細は利用規約をご覧ください。
免責事項
これらの情報および投稿は、TradingViewが提供または承認する金融、投資、取引、またはその他の種類の助言もしくは推奨であることを意図したものではなく、またこれらに該当するものでもありません。詳細は利用規約をご覧ください。