
Hello, dear subscribers!
Today we discuss a very important special case of support line - the Double Bottom chart pattern.
Definition
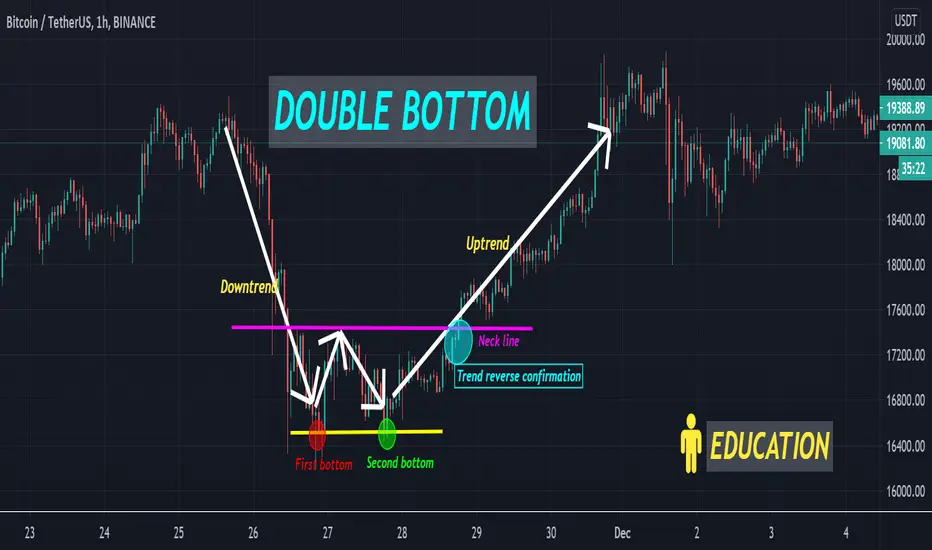
The double bottom usually occurs when price is in the downtrend and bounced off some level (First bottom). After this bounce it seems that the price is going to fall down, but bounces off this level again (Second bottom). If the price reached the neck line (purple line), the probability of the trend reverse is high.
How to trade with double bottom?
You need to specify that price now is in downtrend. After the double bottom is formed, you can wait the price and neck line crossover and enter a long position with some stoploss to eliminate the possible downtrend continuation. Be careful to sole use this pattern, in case of trend reverse it is also confirmed by technical indicators, which we will examine in next posts.
Summary
1)To wait the full double bottom pattern formed
2)To entry a position on the price and neckline crossover
3)To take a stoploss for the downtrend continuation
Today we discuss a very important special case of support line - the Double Bottom chart pattern.
Definition
The double bottom usually occurs when price is in the downtrend and bounced off some level (First bottom). After this bounce it seems that the price is going to fall down, but bounces off this level again (Second bottom). If the price reached the neck line (purple line), the probability of the trend reverse is high.
How to trade with double bottom?
You need to specify that price now is in downtrend. After the double bottom is formed, you can wait the price and neck line crossover and enter a long position with some stoploss to eliminate the possible downtrend continuation. Be careful to sole use this pattern, in case of trend reverse it is also confirmed by technical indicators, which we will examine in next posts.
Summary
1)To wait the full double bottom pattern formed
2)To entry a position on the price and neckline crossover
3)To take a stoploss for the downtrend continuation

Turn TradingView indicator & strategy alerts into automated trades on major crypto exchanges using no-code bots
Start free at skyrexio.com
Start free at skyrexio.com
免責事項
これらの情報および投稿は、TradingViewが提供または承認する金融、投資、取引、またはその他の種類の助言もしくは推奨であることを意図したものではなく、またこれらに該当するものでもありません。詳細は利用規約をご覧ください。
Turn TradingView indicator & strategy alerts into automated trades on major crypto exchanges using no-code bots
Start free at skyrexio.com
Start free at skyrexio.com
免責事項
これらの情報および投稿は、TradingViewが提供または承認する金融、投資、取引、またはその他の種類の助言もしくは推奨であることを意図したものではなく、またこれらに該当するものでもありません。詳細は利用規約をご覧ください。