
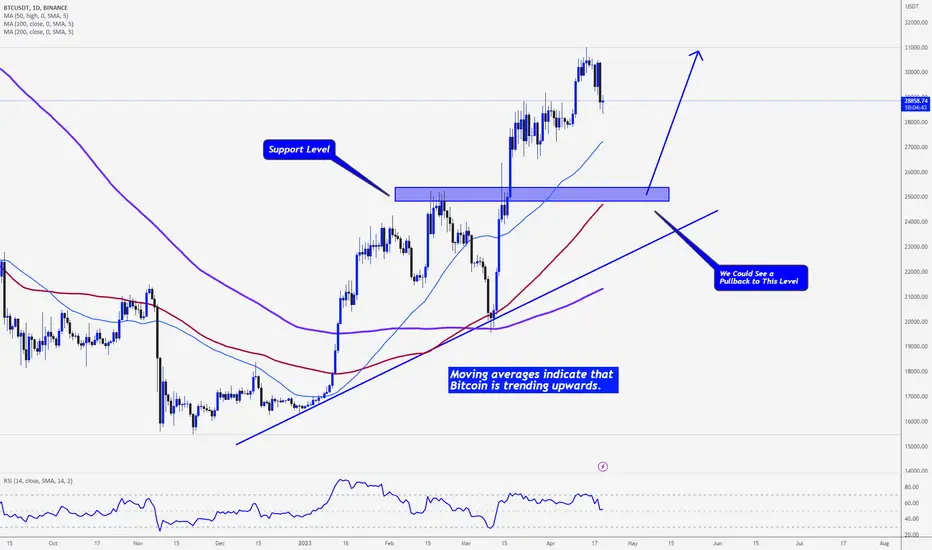
Hey there! So, we're going to talk about Bitcoin prices over the last couple of days. The price of Bitcoin has been jumping up and down quite a bit during this time, with the highest price being 31,000 USD and the lowest being 26500 USD.
Now, let's talk about moving averages. to see where the trend is
50-day moving average: 27215 USD
100-day moving average:24690 USD
200-day moving average: 21312 USD
Right now, the 50-day moving average is higher than both the 100-day and 200-day moving averages, which means that Bitcoin is trending upwards.
Next up, we have a look at the Relative Strength Index (RSI). Right now, the RSI for Bitcoin is at 52.00, which means that the market is pretty neutral - neither really good nor bad.
So, based on all this technical analysis, we can say that Bitcoin is currently on an upward trend.
Now, let's talk about moving averages. to see where the trend is
50-day moving average: 27215 USD
100-day moving average:24690 USD
200-day moving average: 21312 USD
Right now, the 50-day moving average is higher than both the 100-day and 200-day moving averages, which means that Bitcoin is trending upwards.
Next up, we have a look at the Relative Strength Index (RSI). Right now, the RSI for Bitcoin is at 52.00, which means that the market is pretty neutral - neither really good nor bad.
So, based on all this technical analysis, we can say that Bitcoin is currently on an upward trend.
ノート
BTC is now at 50-day MA as predicted, we could find support here, the other scenario is we could see a further pullback to test $25000ノート
up 11% from 50 Day MA, congrats
関連の投稿
免責事項
これらの情報および投稿は、TradingViewが提供または承認する金融、投資、取引、またはその他の種類の助言もしくは推奨であることを意図したものではなく、またこれらに該当するものでもありません。詳細は利用規約をご覧ください。
関連の投稿
免責事項
これらの情報および投稿は、TradingViewが提供または承認する金融、投資、取引、またはその他の種類の助言もしくは推奨であることを意図したものではなく、またこれらに該当するものでもありません。詳細は利用規約をご覧ください。