
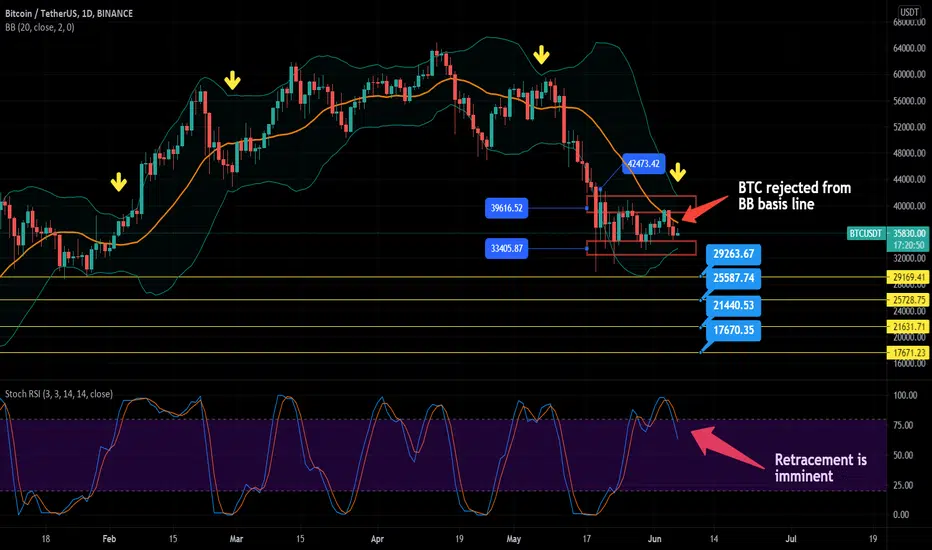
Based on BTC daily chart, it is still consolidating between $33k to $39k range. Usually, the longer the consolidation, the bigger the next move will be.
Based on Bollinger Band indicator, the squeeze of it is so tight where it validates my first statement. The next downtrend move may find support in one of the 4 strong support accordingly. If first support lose, it will go to the next support.
Furthermore, Stochastic RSI is already in the downtrend movement which indicates that a retracement is imminent unless BTC is able to break the Bollinger Band basis line and stay above it. Until then retracement will happen around the corner.
Based on Bollinger Band indicator, the squeeze of it is so tight where it validates my first statement. The next downtrend move may find support in one of the 4 strong support accordingly. If first support lose, it will go to the next support.
Furthermore, Stochastic RSI is already in the downtrend movement which indicates that a retracement is imminent unless BTC is able to break the Bollinger Band basis line and stay above it. Until then retracement will happen around the corner.

関連の投稿
免責事項
これらの情報および投稿は、TradingViewが提供または承認する金融、投資、取引、またはその他の種類の助言もしくは推奨であることを意図したものではなく、またこれらに該当するものでもありません。詳細は利用規約をご覧ください。
関連の投稿
免責事項
これらの情報および投稿は、TradingViewが提供または承認する金融、投資、取引、またはその他の種類の助言もしくは推奨であることを意図したものではなく、またこれらに該当するものでもありません。詳細は利用規約をご覧ください。