
Is Bitcoin's "bottom" reached?
Bitcoin Descending Triangle Analysis 🔥
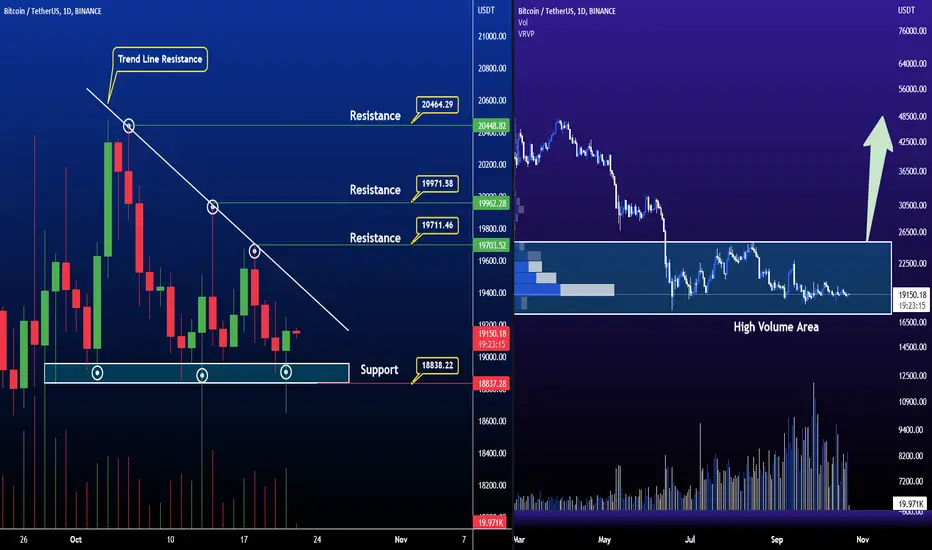
The above chart of Bitcoin ( BTCUSDT ) laid out the descending triangle pattern. This pattern is often regarded as a characteristic of a bearish trend . It is formed by the upper trend line that connects the highs and a horizontal trend line connecting lows converges to form a triangle. If the price action breaches the lower support level , the bearish trend would be sustained.
Currently, Bitcoin ( BTCUSDT ) is in the range of $ 19150. If the pattern continues, the price of Bitcoin ( BTCUSDT ) might reach the support levels of $20000, If the trend reverses, then the price of Bitcoin ( BTCUSDT ) may rise to $18800
Volume Profile View - Good volume has been added at the bottom level
Hope for recovery
Happy Trading
Bitcoin Descending Triangle Analysis 🔥
The above chart of Bitcoin ( BTCUSDT ) laid out the descending triangle pattern. This pattern is often regarded as a characteristic of a bearish trend . It is formed by the upper trend line that connects the highs and a horizontal trend line connecting lows converges to form a triangle. If the price action breaches the lower support level , the bearish trend would be sustained.
Currently, Bitcoin ( BTCUSDT ) is in the range of $ 19150. If the pattern continues, the price of Bitcoin ( BTCUSDT ) might reach the support levels of $20000, If the trend reverses, then the price of Bitcoin ( BTCUSDT ) may rise to $18800
Volume Profile View - Good volume has been added at the bottom level
Hope for recovery
Happy Trading
トレード稼働中
トレード終了: 利益確定目標に到達
Perfect Tradeノート
Agreed
関連の投稿
免責事項
これらの情報および投稿は、TradingViewが提供または承認する金融、投資、取引、またはその他の種類の助言もしくは推奨であることを意図したものではなく、またこれらに該当するものでもありません。詳細は利用規約をご覧ください。
関連の投稿
免責事項
これらの情報および投稿は、TradingViewが提供または承認する金融、投資、取引、またはその他の種類の助言もしくは推奨であることを意図したものではなく、またこれらに該当するものでもありません。詳細は利用規約をご覧ください。