
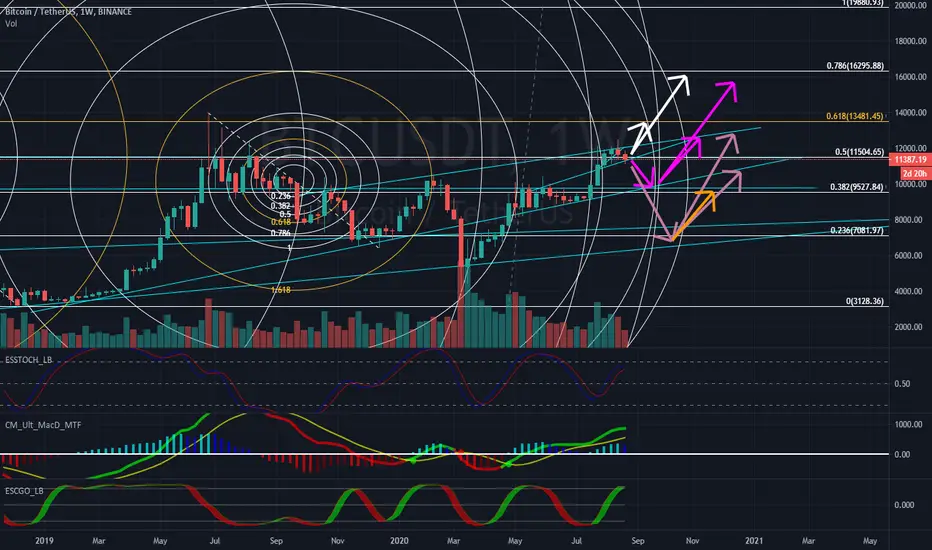
Currently we are either breaking out downward(weekly) or correcting back up into structure(via daily). The weekly candle close will determine is we have broken out of the current structure downward; however, BTC is currently correcting back into the structure as the weekly close approaches.
Weekly indicators:
IF weekly downward breakout holds until close.
Pink: Most plausible in my opinion.
Burnt Orange: Second most plausible according to indicators.
Daily Indicators:
IF weekly closes inside the structure.
White: Looking at the daily this seems to be a fairly likely outcome.
I apologize that my work is messy! Any feedback is appreciated and I hope this helps someone!!
Note: Arrows are not drawn to scale with respect to time, just a general guess of the path it will take price wise.
ノート
Seems to be following the expected path. (Pink)
免責事項
これらの情報および投稿は、TradingViewが提供または承認する金融、投資、取引、またはその他の種類の助言もしくは推奨であることを意図したものではなく、またこれらに該当するものでもありません。詳細は利用規約をご覧ください。
免責事項
これらの情報および投稿は、TradingViewが提供または承認する金融、投資、取引、またはその他の種類の助言もしくは推奨であることを意図したものではなく、またこれらに該当するものでもありません。詳細は利用規約をご覧ください。