
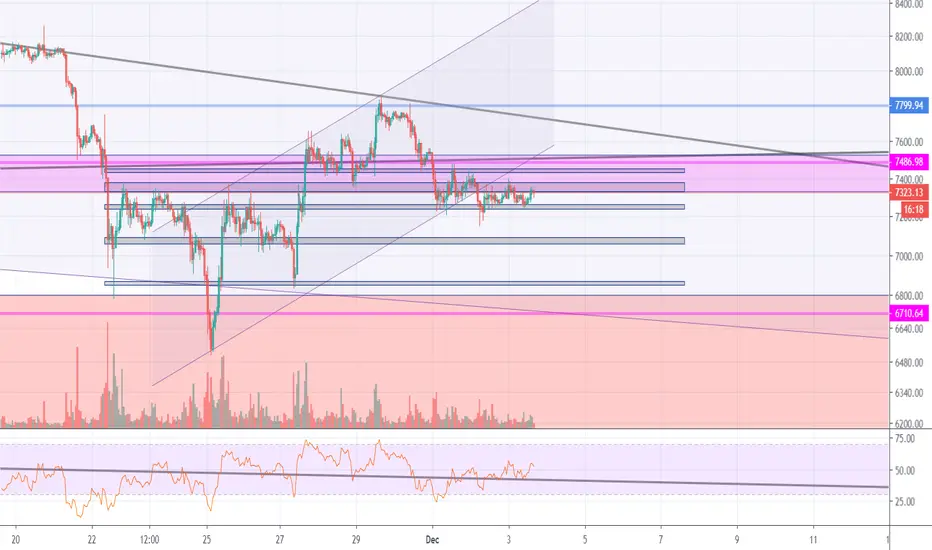
Hey, everybody, I'm the developer of an artificial intelligence buy-sell robot called Mikabot. In the light of the information provided by the new "Channel Bender" module, I added dark horizontal areas to the chart.
You see the dark horizontal areas in the graph.
These areas work as a trend and are the resistance and support of the channels.
The price of Bitcoin will probably find the new direction trapped between these trends.
Let's see what happens.
You see the dark horizontal areas in the graph.
These areas work as a trend and are the resistance and support of the channels.
The price of Bitcoin will probably find the new direction trapped between these trends.
Let's see what happens.

関連の投稿
免責事項
これらの情報および投稿は、TradingViewが提供または承認する金融、投資、取引、またはその他の種類の助言もしくは推奨であることを意図したものではなく、またこれらに該当するものでもありません。詳細は利用規約をご覧ください。
免責事項
これらの情報および投稿は、TradingViewが提供または承認する金融、投資、取引、またはその他の種類の助言もしくは推奨であることを意図したものではなく、またこれらに該当するものでもありません。詳細は利用規約をご覧ください。