
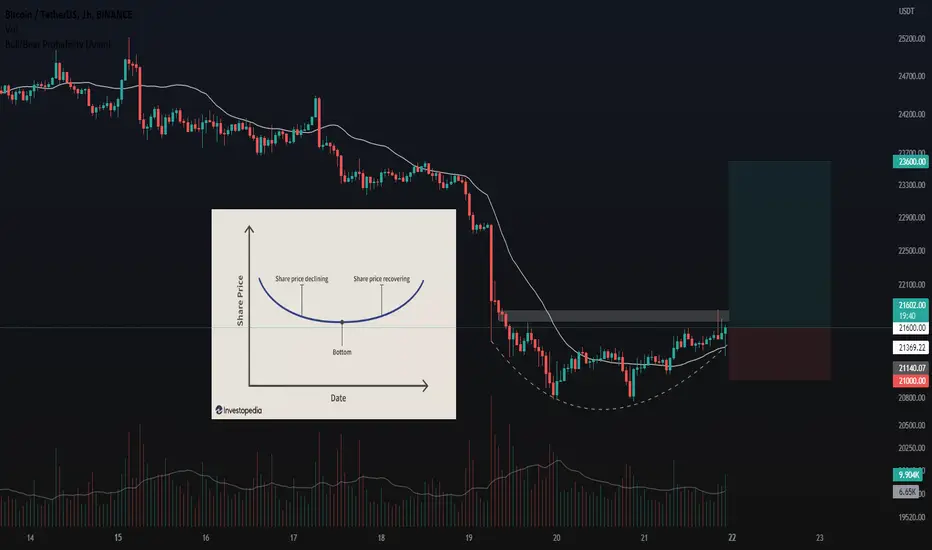
What Is a Rounding Bottom?
A rounding bottom is a chart pattern used in technical analysis and is identified by a series of price movements that graphically form the shape of a "U". Rounding bottoms are found at the end of extended downward trends and signify a reversal in long-term price movements. This pattern's time frame can vary from several weeks to several months and is deemed by many traders as a rare occurrence. Ideally, volume and price will move in tandem, where volume confirms the price action.
-------------
NFA/DYOR.
A rounding bottom is a chart pattern used in technical analysis and is identified by a series of price movements that graphically form the shape of a "U". Rounding bottoms are found at the end of extended downward trends and signify a reversal in long-term price movements. This pattern's time frame can vary from several weeks to several months and is deemed by many traders as a rare occurrence. Ideally, volume and price will move in tandem, where volume confirms the price action.
-------------
NFA/DYOR.

免責事項
これらの情報および投稿は、TradingViewが提供または承認する金融、投資、取引、またはその他の種類の助言もしくは推奨であることを意図したものではなく、またこれらに該当するものでもありません。詳細は利用規約をご覧ください。
免責事項
これらの情報および投稿は、TradingViewが提供または承認する金融、投資、取引、またはその他の種類の助言もしくは推奨であることを意図したものではなく、またこれらに該当するものでもありません。詳細は利用規約をご覧ください。