
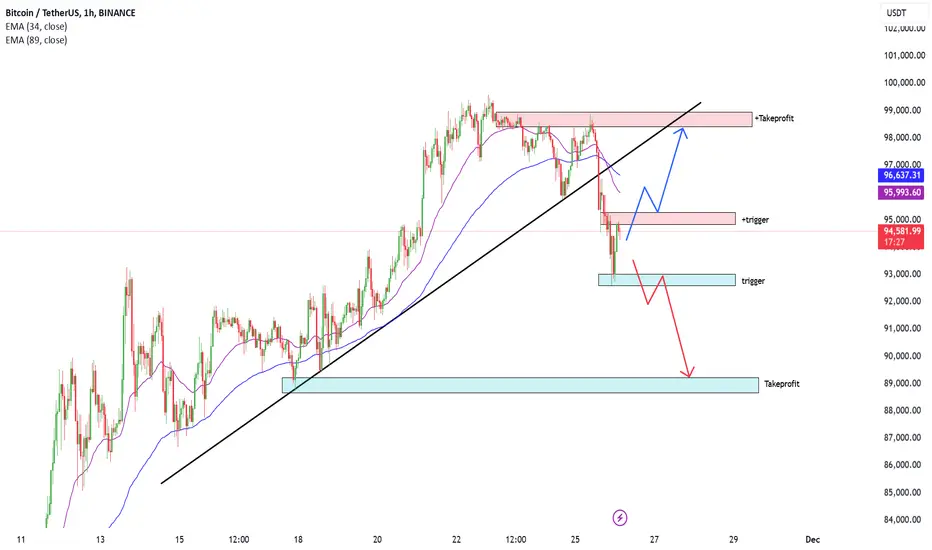
In the recent trading session, Bitcoin (BTC/USDT) is showing signs of strong selling pressure as the price fluctuates around $94,300. The technical chart on the 1-hour chart shows that the price is currently testing important support and resistance zones.
Bullish scenario:
If Bitcoin can break above the trigger zone at $95,200, it will signal a recovery, with a target towards the resistance zone from $98,500. This will require support from positive market sentiment and money flowing back into the crypto market.
Bearish scenario:
On the contrary, if Bitcoin breaks the strong support zone at $92,557, the downtrend may continue with a target of a deeper drop to the $88,700 zone. This will be an important price level to assess the selling momentum in the market.
Bullish scenario:
If Bitcoin can break above the trigger zone at $95,200, it will signal a recovery, with a target towards the resistance zone from $98,500. This will require support from positive market sentiment and money flowing back into the crypto market.
Bearish scenario:
On the contrary, if Bitcoin breaks the strong support zone at $92,557, the downtrend may continue with a target of a deeper drop to the $88,700 zone. This will be an important price level to assess the selling momentum in the market.

関連の投稿
免責事項
これらの情報および投稿は、TradingViewが提供または承認する金融、投資、取引、またはその他の種類の助言もしくは推奨であることを意図したものではなく、またこれらに該当するものでもありません。詳細は利用規約をご覧ください。
関連の投稿
免責事項
これらの情報および投稿は、TradingViewが提供または承認する金融、投資、取引、またはその他の種類の助言もしくは推奨であることを意図したものではなく、またこれらに該当するものでもありません。詳細は利用規約をご覧ください。